Co-author Neil Sullivan is a Rates Specialist at the Environmental Finance Center.
Since 2007, the Environmental Finance Center at the University of North Carolina at Chapel Hill has been conducting water and wastewater rate surveys in Georgia. With support from the Georgia Environmental Finance Authority and other organizations[1], the EFC at UNC has collected a decade worth of rates data. Each year this data allows the us to create water and wastewater Rates Dashboards. This free tool helps utility staff analyze and weigh their current rates against different indicators to better inform future rate settings. Additionally, this data reveals important trends in how Georgia utilities manage their finances. Read on to see how the landscape of water and wastewater rates has transformed in the past decade:
Note About the Survey Data Set
All trends analyzed below use data from 233 water and 187 wastewater utilities that participated in the rate survey each year since 2007. Each year, an average of 462 (87 percent) water and wastewater utilities respond to the survey out of the average 529 utilities that are contacted. The high response rate of 87 percent is in large part due to the relative ease of utility participation. Once the utility provides some basic information on its rate structure, the EFC at UNC is able to generate a dashboard, individual rate sheets, and a written report that, over time, answer some hard-hitting questions such as:
How Have Rate Structures in Georgia Changed Over Time?
There has been a significant transition in the types of rate structures used by water utilities in Georgia over the past ten years. In 2007, uniform rate structures comprised 64 percent of the 233 water utilities’ residential rate structures. However, by 2017 the percentage of uniform rate structures had decreased to 39 percent. Similarly, decreasing block rate structures went from being used by 8 percent of utilities in 2007 to only 3 percent in 2017.
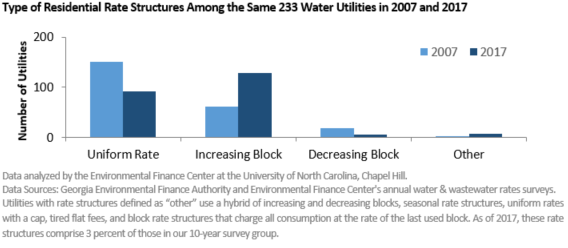
Conversely, the proportion of increasing block rate structures has risen from 33 percent in 2007 to 48 percent by 2017. This switch to increasing block rates has been driven by conservation efforts, specifically through the Water Stewardship Act (Tolleson, SB 370) enacted in 2010.
How Has Consumption Allowance Changed Over Time?
Most utilities in Georgia have a base charge for residential water and wastewater customers, which can include a consumption allowance. The number of utilities that include a consumption allowance in the base charge for water or wastewater rate structures has declined over time. In 2007, 77 percent of water and 62 percent of wastewater utilities included some volume of consumption in their base charge. Between 2007 and 2017, these percentages dropped to 63 percent for water and 52 percent for wastewater utilities. The current trend means that more customers pay for every unit of water they use.
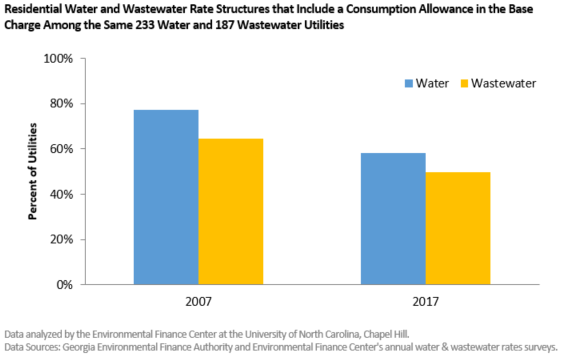
Between 2008 and 2009, the percentage of utilities providing consumption allowances dropped more than all other survey years combined, which may be attributed to the drought conditions in Georgia at the time. When the average consumption of water per customer decreases, utilities often decrease or remove their consumption allowances in order to capture revenue from volumetric charges at lower consumption points. For utilities that continued to provide a consumption allowance, the average size of that allowance decreased over time as well. In 2007, the average consumption allowance for water usage was 2,200 gallons; that has now decreased to an average of 2,000 gallons in 2017.
How Have Utilities Changed Their Rates?
For the 233 water utilities and 187 wastewater utilities that have provided rates data since 2007, on average, slightly less than half raised rates from one year to the next. After a spike in 2009, the number of utilities changing rates each year generally decreased. Most utilities raised rates at least once in the past decade, with a median of four rate changes in 10 years. More water utilities did not change their rates at all in the last 10 years than changed rates every year. Eleven wastewater utilities did not change rates in the last decade and only two changed rates every year.
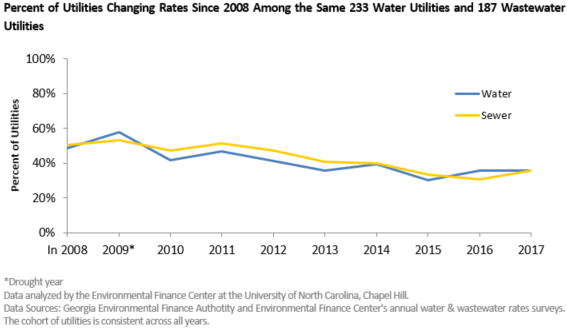
The effects of a drought in 2008 affected the water market, shown by the sharp increase in rate changes adopted by water utilities in the survey group. Among water utilities that raised rates between 2008 and 2009, the median bill increase was 10.6 percent, or $2.18. The top tenth percentile of utilities who raised water rates sent a conservation pricing signal to customers by increasing bills for 5,000 gallons between $6.50 – $10.83, or up to 69 percent. Once the drought subsided in 2010, water utilities were much less likely to increase rates by more than 10 percent, a trend which has continued through 2017. Among water utilities that have changed rates, the median percentage increase from year to year has hovered around 5 percent, which has ranged from $1.16 – $1.45 per year. For the 187 wastewater utilities that provided rates for every year, the same trend is seen, albeit with less volatility than in water rates.
These ten years not only mark an anniversary for water rates surveys in Georgia, but also a milestone for the EFC in data collection for one region. As water prices increase and new policies develop, analyzing data of utilities at the statewide level can provide crucial insight to utilities, government officials, and other stakeholders. To read other significant ten-year trends in Georgia, be sure to read the 2017 Georgia Water and Wastewater Report.
Special thanks to our EFC at UNC colleagues who contributed to this post: Stacey Isaac Berahzer, Annalee Harkins, and Andrea Kopaskie.
[1] Georgia Association of Water Professionals, Georgia Municipal Association, Georgia Department of Natural Resources’ Environmental Protection Division, Georgia Department of Community Affairs, Association County Commissioners of Georgia, Georgia Rural Water Association, and US Environmental Protection Agency
Claudia Flores is the Project Coordinator for the Environmental Finance Center and works from a satellite office in Georgia. She graduated from the University of California, Los Angeles where she majored in Environmental Science and minored in Environmental Systems and Society.