The 1997 EPA Financial Capability Assessment (FCA) consisted of a two-part assessment to determine a municipality’s financial capability to implement projects to comply with Clean Water Act (CWA) requirements. The EPA has used the 1997 FCA to negotiate implementation schedules for both combined sewer overflow and sanitary sewer overflow controls. The first part of this assessment is the Residential Indicator (RI), which is the cost per household of CWA compliance divided by the median household income. The second part is the Financial Capability Indicator, which evaluates the municipality’s fiscal health and its demographics relative to national norms.
In part due to the simplicity of the Residential Indicator, the water and wastewater community has used a similar metric known as median affordability or % median household income (MHI) to assess affordability at the local level. Median affordability is the annual water and wastewater bill at a set consumption volume divided by the MHI of the service area. State revolving funds also have used median affordability to determine which municipalities are eligible for principal forgiveness on loans. The difference between the RI and median affordability is that median affordability uses the current cost to the customer and the RI uses the total cost to implement CSO or SSO controls to comply with Clean Water Act requirements. Because both the RI and the median affordability rely on MHI to determine affordability, they have both received criticism over the years, including from the EFC (here, here, here).
In 2014 the Environmental Finance Advisory Board sent a memo to the EPA reviewing the 1997 FCA and recommending that the EPA include additional metrics and analysis to consider all costs of living for the customer including other utility fees like stormwater and to consider the differences in cost burdens borne by renters versus homeowners. In 2017, the National Academy of Public Administration published a report providing further criticism of the existing framework. The summary of the criticism of the Residential Indicator from this report and from others in water, including Dr. Manny Teodoro, Professor at the University of Wisconsin-Madison, is that the Residential Indicator:
- Obscures the impact on low-income households by only examining the impact on the median income household.
- Does not include the full cost of water by omitting stormwater cost and taxes that subsidize the utility enterprise fund.
- Ignores other essential costs of living and thus ignores economic tradeoffs that low-income households face.
- Does not measure the extent of low-income affordability issues.
- Relies on the 2% threshold for determining affordability, which is arbitrary.
- Ignores trends in the data.
If the Residential Indicator fails to address these shortcomings, what are other metrics that may? The Environmental Finance Center recently completed a project with the EPA to analyze 12 affordability metrics in a 2019 report by NACWA, AWWA, and WEF titled “Developing a New Framework for Household Affordability and Financial Capability Assessment in the Water Sector.” Partnered with our sister Centers in Maryland, New Mexico, Kansas, and California, we utilized a case study approach to calculate these metrics with 16 communities across the country and solicit their feedback on the metrics. Let us look at three of the 12 metrics included in that report and how they address the above criticism.
- Household Burden Indicator (HBI) and Poverty Prevalence Indicator (PPI)
The HBI assesses the cost of basic water service as a percentage of the 20th percentile household income in a community. Basic water service includes water, wastewater, and stormwater and assumes 50 gallons per person per day for the average household size in the service area. The PPI is the percentage of households below 200% of the federal poverty line. HBI and PPI values are combined in the matrix below to determine community water affordability burden.
| HBI – Water Costs as a Percent of 20th Percentile Household Income | PPI – Percent of Households at or Below 200% of FPL | ||
| >= 35% | 20% to 35% | < 20% | |
| >= 10% | Very High Burden | High Burden | Moderate-High Burden |
| 7% to 10% | High Burden | Moderate-High Burden | Moderate-Low Burden |
| < 7% | Moderate-High Burden | Moderate-Low Burden | Low Burden |
How well does HBI and PPI address criticisms?
The HBI includes the total cost of water by including wastewater and stormwater costs but does not consider tax dollars paid to the general fund for enterprise fund subsidization. The HBI and PPI together address both measuring low-income user affordability and measuring the extent of low-income affordability issues. The determination of burden level follows a 9-cell matrix, which is more flexible than the 2 percent threshold for RI but does not consider CPI or the cost of other necessities. The HBI and PPI do not consider data trends.
- Affordability Ratio at 20th Income Percentile (AR20)
The AR20, developed by Dr. Teodoro, is the basic monthly cost of service for water and wastewater divided by the money remaining after a 20th income percentile household pays for essential expenses. Essential expenses include housing, food, healthcare, home energy, and taxes. In reality, low-income households are constantly making trade off decisions on expenses. In fact, for 4 of the 16 case studies that we completed in this project, essential expenses exceeded 20th percentile household income. The current proposed benchmark is 10 units. Dr. Teodoro published a paper in 2017 that case studies AR20 calculations in 25 cities throughout the United States.
How well does the AR20 address criticisms?
The AR20 includes the total cost of water by including wastewater and stormwater costs. The AR20 indirectly considers tax dollars paid to the general fund for enterprise fund subsidization by including the tax dollars that individuals pay among the essential costs in the calculation. The AR20 addresses low-income user affordability but does not measure the extent of low-income affordability issues. The AR20 relies on a single threshold of 10 to determine affordability, but this threshold was proposed based on case studies. The AR20 does not consider data trends.
- Hours at Minimum Wage
Hours at minimum wage is the basic monthly cost of service divided by the local minimum wage. The affordability benchmark is 8 hours.
| Benchmark | Affordability Burden |
| < 8 hours | Not Cost Burdened |
| > 8 hours | Cost Burdened |
How well does hours at minimum wage address criticisms?
Hours at minimum wage does not include the total cost of water. While water and wastewater costs are considered, stormwater is not. Hours at minimum wage does not consider tax dollars paid to the general fund for enterprise fund subsidization. Hours at minimum wage addresses low-income user affordability but does not measure the extent of low-income affordability issues. The determination of the burden level threshold of 8 hours may be arbitrary, like the potential issue of the 2 percent threshold for RI. Hours at minimum does not consider data trends.
Conclusion
These three metrics can provide further context on a utility’s customer-level affordability and come closer to addressing the criticisms in the 2017 NAPA report, but no one metric is perfect. The EPA continues to workshop their recommended metrics and is in the process of developing the 2020 Financial Capability Assessment Guidance, which is still in draft form following a period of public comment.
Assessing Affordability at the Local Level
The EFC is exploring using these alternative methods in our applied research to allow local governments to better assess affordability at the local level. The use of the above metrics for determining CSO and SSO implementation schedules relies on pre-determined benchmarking to determine burden level. When assessing affordability internally for rate setting decisions, local governments have flexibility in determining their own benchmarks and choosing which metrics to use.
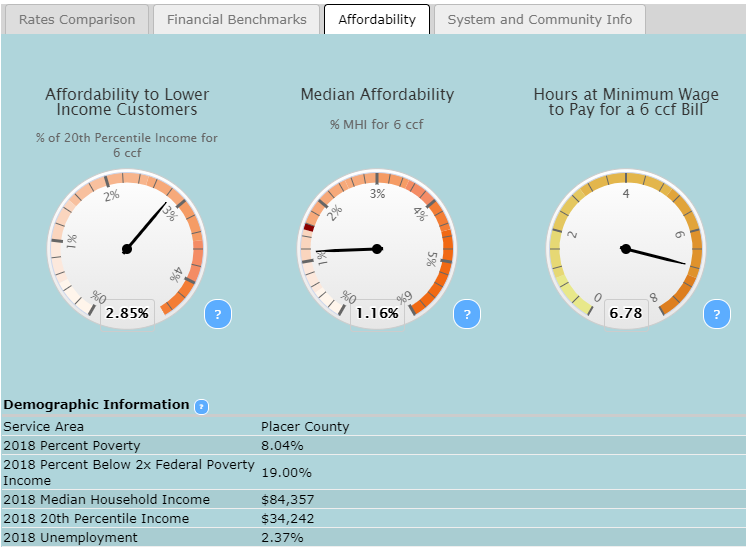
We recently added an affordability tab to our California Small Water Systems Rates Dashboard where you can explore the cost of water at 600 cubic feet (4,448 gallons) per month as a percentage of 20th percentile income and the hours at minimum wage to pay for 600 cubic feet. Which metrics does your utility use to assess affordability at the local level? Share your thoughts in the comment section below.
Evan Kirk joined the EFC at UNC in 2016 as a rates dashboard student, later serving as a research assistant until May 2019. In his current role as project director, he conducts applied research on water, wastewater, and stormwater finance topics and administers technical assistance and trainings for small systems. Kirk graduated from UNC in 2016 with a BS in environmental science. He later earned a master’s certificate in GIS science from the Department of Geography at UNC in 2017 and a master’s in city and regional planning with a concentration in land use and environmental planning from UNC in 2019.