This is the second post in a three-part blog series on data management. This post will focus on the data handling processes involved in the development of the EFC’s Revenueshed tool.
As mentioned in the first part of this blog series If you build the data platform, will they come?, EFC’s design team regularly asks the following three questions when creating a new tool.
(1) Who are the users?
(2) What is the project’s purpose?
(3) What data exists to support this purpose?
Developing an effective web-based data visualization requires the design team to consider a variety of factors pertinent to user-interface design. Designers must have a holistic understanding of their target audience—identifying their users’ expected behaviors, needs, and motivations. Additionally, the design team must outline specific objectives for the visualization’s performance, defining expectations for interactivity, communication and function. Lastly, to pull it all together, the designers must determine what underlying data sources and connections are needed to bring their design to life.
Revenueshed Tool
In the fall of 2020, my colleagues and I created an interactive data visualization dashboard in Tableau as part of the North Carolina Legislature commissioned Falls Lake Nutrient Management Study. This Revenueshed tool illustrates a novel approach to generating funds for a designated project goal, by manipulating various revenue streams, including property taxes, water and wastewater rates, and stormwater fees.
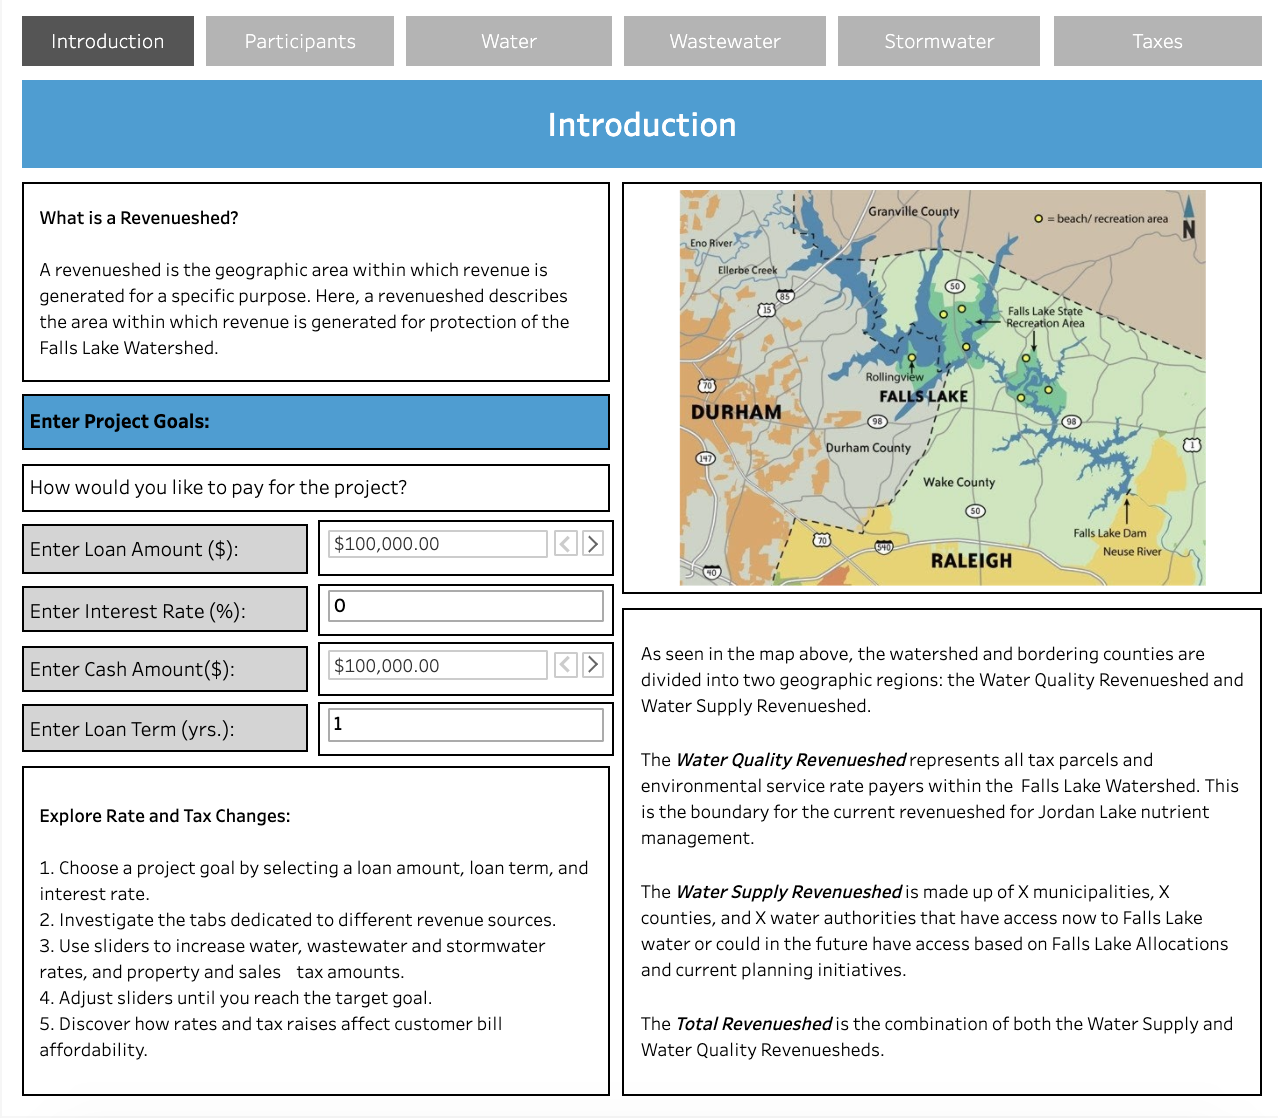
Introductory Page of the Falls Lake Revenueshed Tool
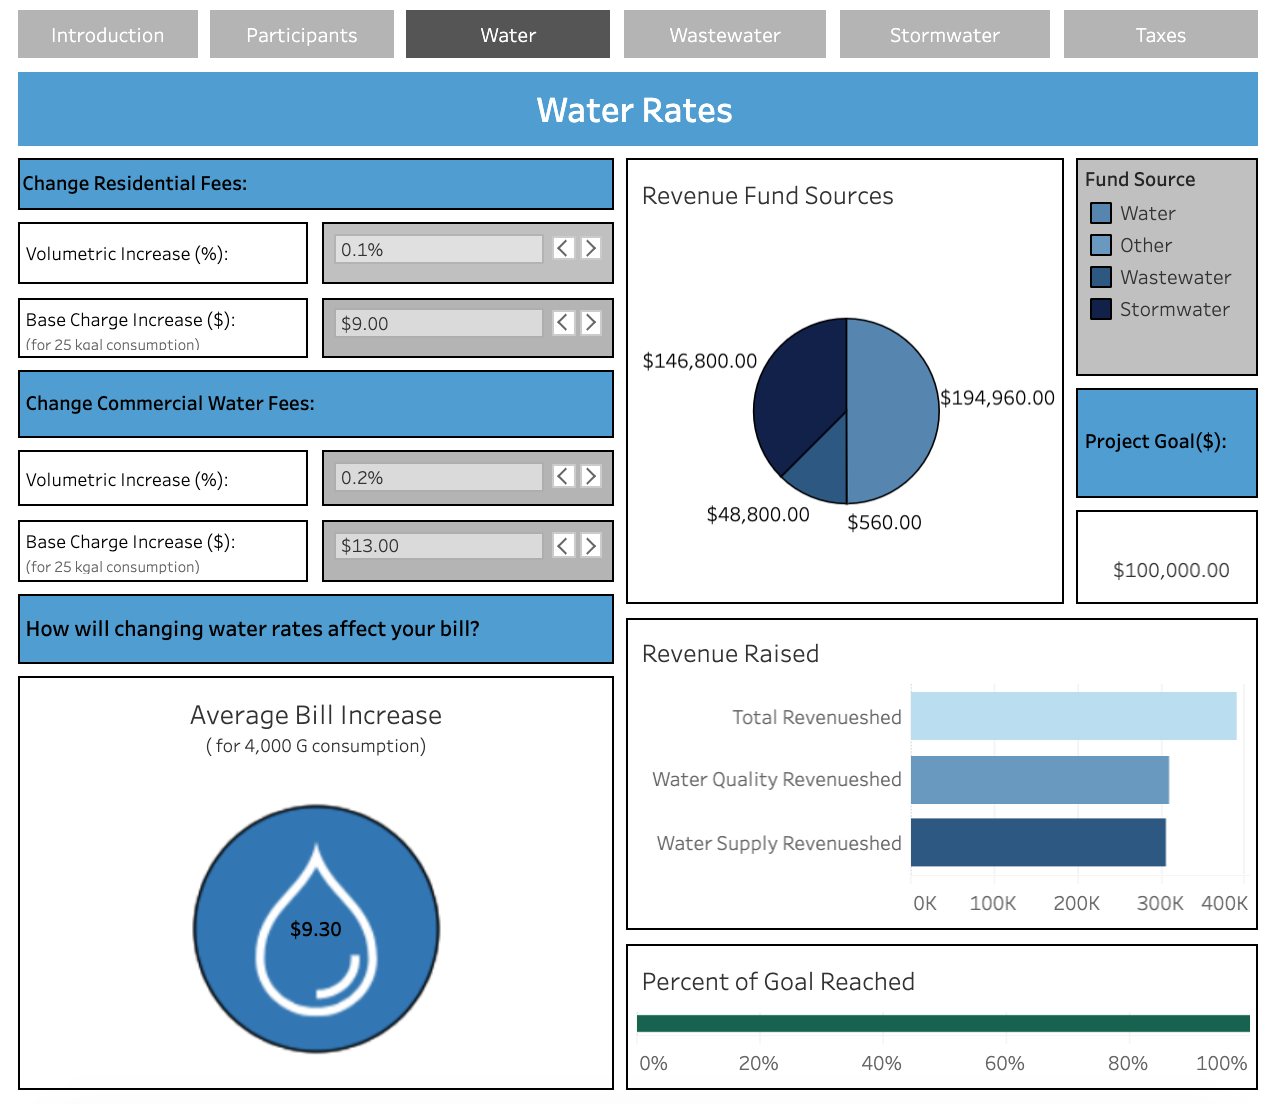
Water Rates Page of the Falls Lake Revenueshed Tool
Who are the users?
The tool is designed for decision makers, board members, environmental non-profit groups, and others to investigate the revenue sources available to meet a specified fund amount. The tool helps these folks communicate this information in a compelling fashion to interested parties. Interacting with the tool, you can select a project goal and choose to source funding through a loan, cash, or a combination of both. You can then increase existing sources of revenue available to reach the identified project goal. You can also view how revenue generation differs based on the local municipalities selected to participate.
What is the project’s purpose?
The tool’s purpose is to explore the Revenueshed model for the Falls Lake Watershed, facilitating interactive decision-making, analysis of creative funding solutions, and discussion among watershed stakeholders. The EFC hopes that this tool will encourage collaboration among local governments and assist in policy-making.
What data exists to support this purpose?
In order to populate the Revenueshed tool with information on water and wastewater rates, stormwater fees, and property and sales taxes, we compiled and cleaned a significant amount of data. For this research, the EFC calculated potential scenarios based on manipulating several revenue generation structures in the Falls Lake watershed. Data was sourced from the EFC’s internal water and wastewater database, the U.S. Census, and other publicly available domains, and subsequently shaped to conform to a format suitable for Tableau. Following upload of the formatted data, we performed a series of calculations in Tableau to build the interactive elements of the tool.
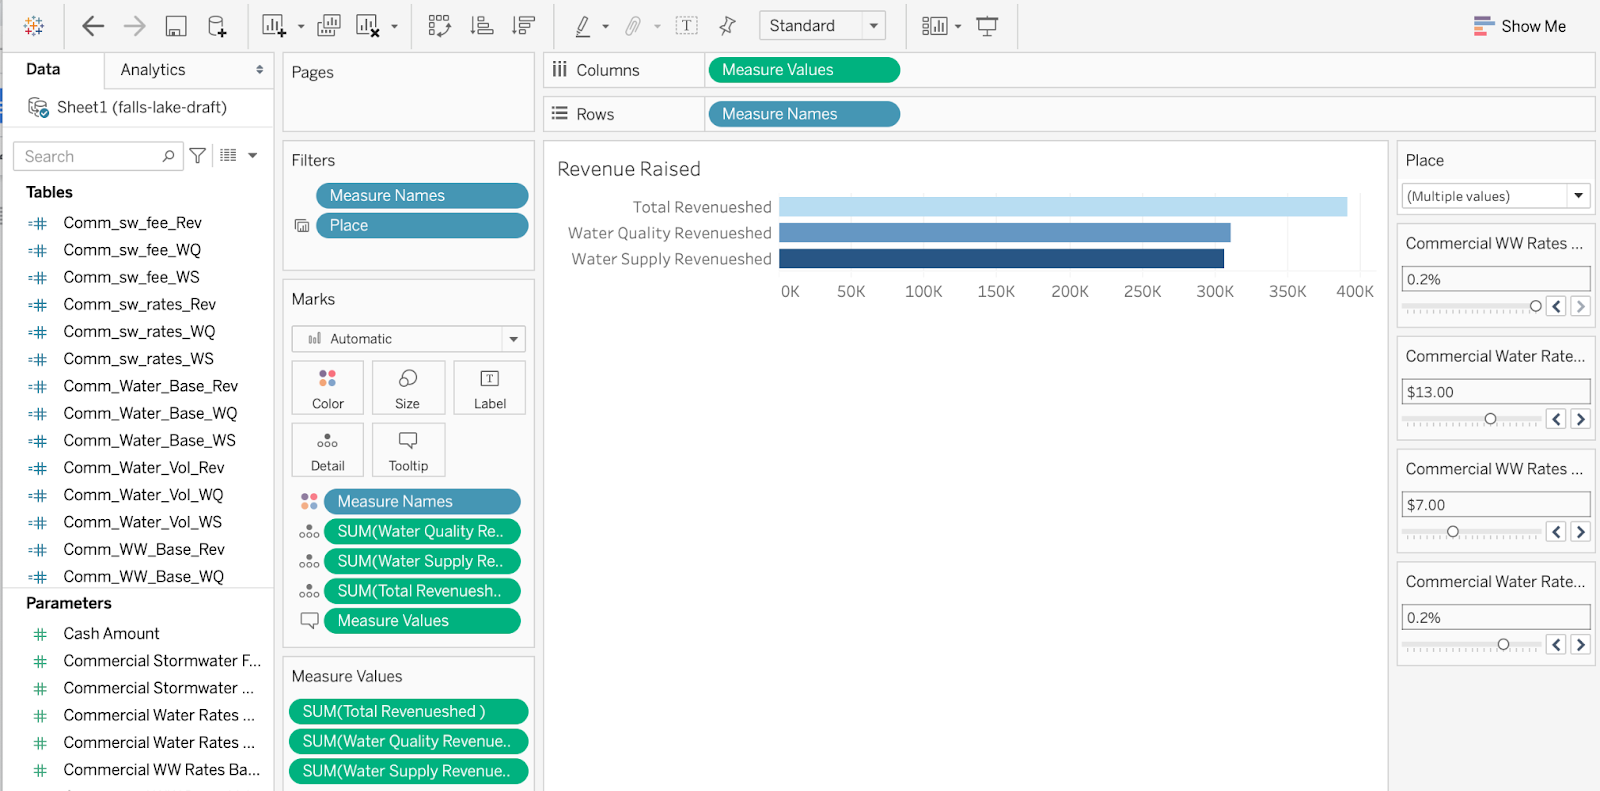
Example Data Planning Sheet for the Falls Lake Revenueshed Tool
Expansion of the Revenueshed Tool
Starting in January of this year, the process outlined above has been replicated in a streamlined manner to develop an additional Revenueshed tool, in the Beaver Lake Watershed in Northwest Arkansas. The EFC hopes through the standardization and improvement of data acquisition and manipulation practices that the Revenueshed concept will continue to be applied with relative ease to future watersheds.
Cassidy joined the EFC in 2020 as a research assistant on the EPA Exchange Network project. She is a first year in the Master of Information Science program at the School of Information and Library Science. Cassidy graduated from the University of North Carolina at Chapel Hill in 2019 with a B.S. in Environmental Science.
One Response to “Behind the Scenes of the Revenueshed Tool”
Using IT Design Methods to Improve Software Tools - Environmental Finance Blog
[…] the first and second part of this blog series, If you build the data platform, will they come? and Behind the Scenes of the Revenueshed Tool, the Environmental Finance Center (the EFC) project designers have to know the users, identify […]