Dayne Batten is a Research Assistant for the EFC and second year MPA student at UNC-Chapel Hill’s School of Government.

Traditional engineering plans suggest that, when customer demand approaches the maximum daily capacity of a utility’s treatment plant, the utility should make an expansion to its plant sufficient to handle several decades of growing demand. By following such a strategy, utilities will have a significant amount of excess capacity in the years immediately following a plant expansion. Hence, utilities may face a tradeoff between building a treatment plant capable of serving their needs for quite some time, or expanding their plant incrementally to control fixed costs. As part of our ongoing research into resilient business models for water and sewer utilities, we wanted to see if utilities that were using a greater percentage of their treatment plant capacity tended to be in better (or perhaps worse) financial health.
Data compiled by Raftelis Financial Consultants for the American Water Works Association (AWWA) and data from the North Carolina Department of Environmental and Natural Resources Local Water and Sewer Supply Planning program (LWSP) gave us a way to make the comparisons. The AWWA data represented a survey of utilities from across North America in every even year from 2000 to 2012. The LWSP data gave a snapshot of North Carolina utilities in the years 2010 and 2011.
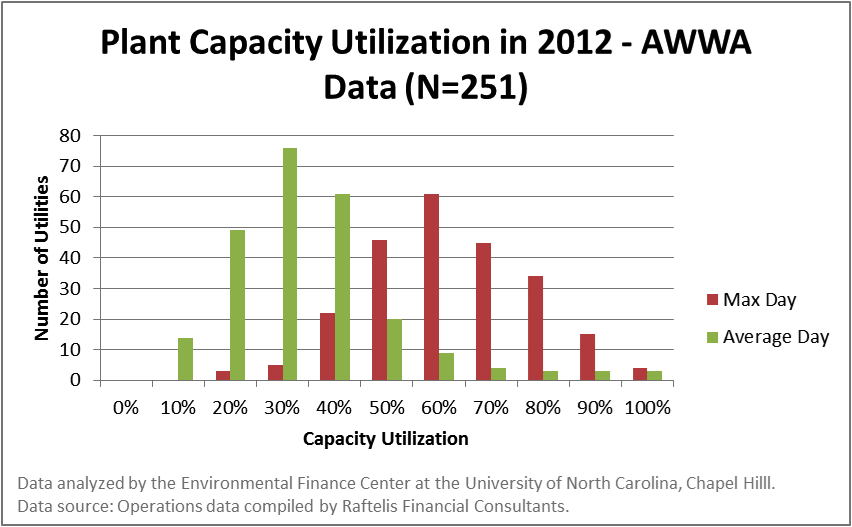
Both data sets showed that the vast majority of utilities produce far less drinking water on an average day than their plants have the capacity to generate. In the 2012 AWWA data, depicted in the chart below, the average utility used only 45% of its treatment capacity on an average day. Max day use was much higher, however, with the average utility using 75% of its treatment capacity on days with the highest demand. According to AWWA figures, these percentages declined slightly between 2000 and 2012 – a trend likely explained by utilities continuing to build planned infrastructure expansions even as water demand has fallen in recent years.
Comparing plant capacity figures to utility financial data (gathered as part of the AWWA survey or provided by the NC Local Government Commission) allowed us to look at the role of plant capacity use in determining utility health. To assess this, we looked at several different financial indicators including:
- Operating ratio (operating revenues / expenses)
- Debt ratio
- Debt service coverage ratio
- Return on assets
Across each of the indicators, we found very little evidence that plant capacity utilization had an effect on utility financial health. In fact, in a series of regression models, the only financial ratio that was observed to be significantly related to plant operations was the operating ratio. As shown in the chart below, we observed that utilities in the LWSP data with plants operating at <50% of capacity tended to have higher operating ratios than those without plants (many NC utilities purchase drinking water from other utilities or use ground water sources that do not require purification). Those with plants operating at >50% capacity had still higher operating ratios, though the difference was not statistically significant. Thus, there is evidence that having a plant increases utility operating ratios, but not that greater use of existing plant capacity changes operating ratios.

The difference between utilities with plants and those without for the operating ratio is not terribly surprising. Utilities with plants are likely to have debt burdens from loans taken out to build their plants. Thus, they will need revenues left over after their operating expenses are paid in order to service their debt. More revenues than expenses means a higher operating ratio.
Ultimately, therefore, we found no evidence that plant capacity utilization helps or hinders utility financial health, at least on an average basis. That is not to say, however, that unfortunate decisions with respect to plant assets could not adversely impact utility finances, or that smart decisions cannot help a utility perform better. It simply means that there is no evidence that the tradeoff between incremental plant expansions and large, one-time expansions has any long-term effects on utility finances.
One Response to “Financial Health: Running Treatment at Capacity”
Darin Kamradt
I agree that a direct connection between “financial health” and plant capacity is very difficult to make. However, I believe the connection is there indirectly. The correct financial metric to use is Fixed Asset Turnover Ratio (Total Annual Revenue / Total Fixed Assets). In other words, how much revenue is generated for every dollar of fixed assets. A service company like an engineering firm typically generates $5 for every $1 of assets. Airline companies are typically around $1.5 of revenue for every $1 of assets. Water utilities are routinely at 10 to 20 cents of revenue for every $1 of fixed assets. This is a terrible ratio! The lower this ratio, the higher the debt, maintenance, operating costs, and asset replacement costs are all going to be. Correspondingly, the higher the water rates will be. To the extent that water rate increases can’t happen because the rates are already high driven by excess capacity, the more financial risk a water utility is in. Total water consumption is declining because winter consumption is declining. But, the desire to irrigate is increasing in many communities. So, average day demands are dropping while max day demands are flat or increasing. This is causing our asset utilization to get worse in an industry that is the most asset intensive. This is an extremely problematic trend for the industry because it becomes a big driver of water rate increases. Follow the money. If most of our revenue requirements are driven by building, financing, maintaining, and replacing assets, then asset utilization must be a KEY financial driver. Look at utilities with the highest water rates and I will wager that you will also find the utilities with the lowest (worst) fixed asset turnover ratios.