Every year, the United States Bureau of Labor Statistics (BLS) publishes data on household expenditures, income, and demographics collected through the Consumer Expenditure Survey. This nationally-representative survey reveals, among other things, how much households are spending on electricity, water and other public services, natural gas, fuel, and telephone services. This blog post summarizes how average household expenditures for these services have changed since 2000.
About the Consumer Expenditure Survey
The Consumer Expenditure Survey is conducted every year by the U.S. Census Bureau and the data is provided in the form of Public-Use Microdata files by the BLS. In addition to reporting the spending habits and characteristics of consumer units across the country, the results of the survey are used to define the basket of goods and services in the Consumer Price Index to calculate inflation, and to calculate certain poverty thresholds. Data is aggregated at the national, regional, and state levels and may be downloaded for free in multiple formats to serve a variety of research needs.
Consumer expenditure data is collected through the use of two separate survey instruments. The first is a quarterly interview that captures data on large purchases such as property, major durable goods, and vehicles, as well as recurring expenses like rent and utilities. The second is a diary survey that requires respondents to record all of their expenditures—large and small—during two consecutive week-long periods. The sample is different for the interview and diary surveys. For the interview, the BLS collects useable data from approximately 28,000 consumer units per year. The diary survey is issued to a smaller number of potential respondents than the interview survey and the placement of diaries is intended to occur evenly over all 52 weeks of the year. The BLS collects around 14,000 completed diaries from roughly 7,000 consumer units per year.
Because the data are available on individual consumer units (e.g. households), utilities interested in studying the household impacts of their own utility rate changes may be tempted to use the Consumer Expenditure Survey microdata files. However, because of very small sample sizes at the local level (some utilities may find no more than one or two respondents that are within their service boundary), the results of this survey may not be as useful at the local level as they are on a regional or national level.
Trends in Expenditures on Utilities
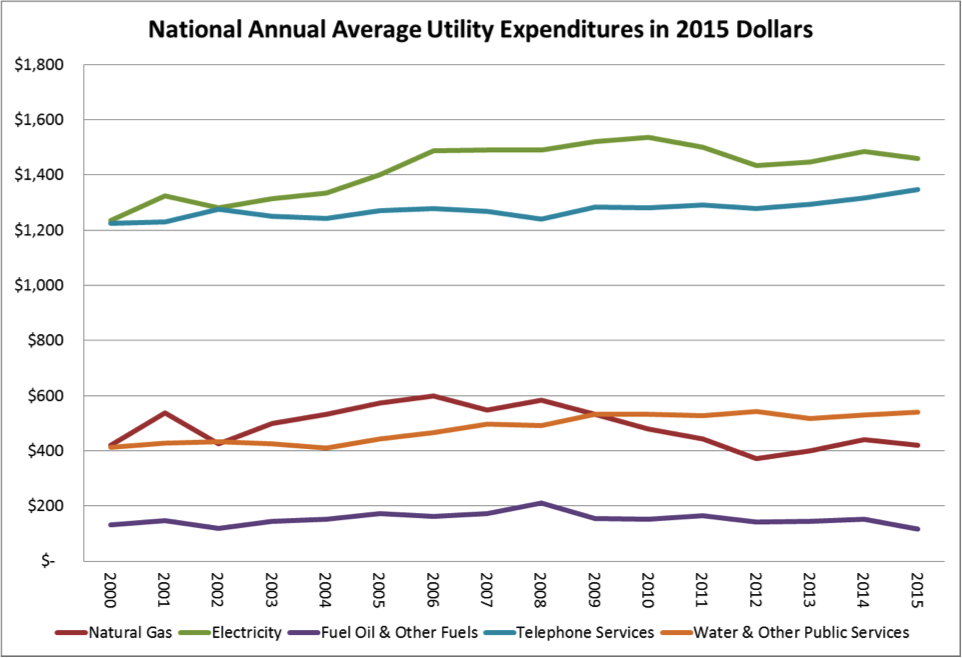
Using the BLS-published result tables, I compared national-level average annual home expenditures on “utilities, fuels, and public services” from 2000 through 2015, adjusting all figures to 2015 dollars to account for inflation. The main results from the Consumer Expenditure Surveys are:
- Households spend more on electricity, and similarly more on telephone services, than on natural gas, fuel oil, and water & other public services combined.
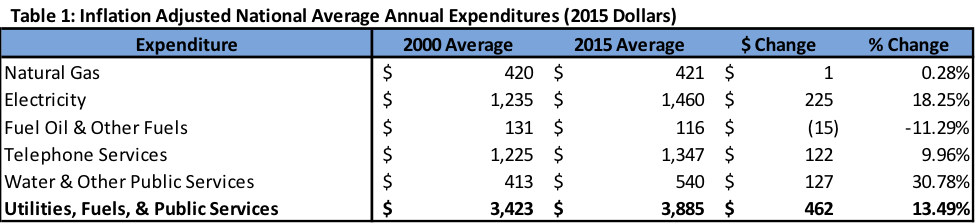
- The total inflation-adjusted average annual expenditure on all Utilities, Fuels, & Public Services rose slowly to $3,885 in 2015 – an increase of $462, or roughly 13.5 percent, in 15 years since 2000. As a share of pre-tax income, expenditures have risen from 4 percent in 2000 to 5.6 percent in 2015.
- Electricity, telephone, and water & other public services have gotten more expensive since 2000, while fuel oil and natural gas inflation-adjusted expenditures have remained somewhat stable. Average annual inflation-adjusted expenditures on electricity and water & other public services have risen 18.3 percent and 30.8 percent, respectively, in those 15 years. This increase has led expenditures on water & other public services to rise from 0.5 percent of pre-tax income to 0.8 percent, on average.
Table 1 provides a summary of these changes.
Researchers interested in household expenditures on utilities at the state or local level should, however, take these trends with a rather large grain of salt. First, using national averages obscures local utility costs, which can vary significantly from state-to-state, and even neighborhood-to-neighborhood. Second, for more localized analysis it is likely more appropriate to compare median values instead of averages, since median values are less influenced by outliers. Third, annual averages mask seasonal differences that may impact affordability and cost for customers based on local climate. Overall, the Consumer Expenditure Survey is a great resource for assessing general trends nationwide, but its usefulness likely decreases for smaller geographies. Outside of larger MSAs, sample sizes in the public use microdata files may be too small to draw conclusions with a reasonable level of confidence. National and state-level researchers might therefore find appropriate uses for this data source, but utility managers and local officials interested in local trends and comparisons may be better served to seek out alternative data sources, like the EFC’s rates tables and water and wastewater rates dashboards.
Trey Talley is pursuing a Master’s of City and Regional Planning at the University of North Carolina Chapel Hill, and he currently serves as a research assistant for the Environmental Finance Center.
One Response to “How Much Do Households Pay for Utilities, Fuels, and Public Services?”
Jeffery Smith
Hi. How much money do Americans spend for water outside of agricultural use? That is, annually, how much do households spend? How much does industry spend for water? If there’s another major user group I’ve not thought of, how much do they spend on water each year? Thanks.