Post by Julia Cavalier, Senior Research Project Director at UNC Environmental Finance Center
Lead service line inventories are required by the Revised Lead and Copper Rule. Systems with distribution lines built after lead was banned are likely grateful as this work can be costly and poses a significant challenge to utility directors tasked with replacing lead lines in their system. However, as a silver lining for everyone else, utility directors have a unique opportunity to couple the lead and copper line inventories now required by law with other needed repairs or preemptive upgrades to their system, maximizing their funding investment.
The first hurdle is identifying the locations of these lines. Luckily, data models can help streamline the process by identifying areas likely to have problematic lines. Creating a data model is a significant upfront investment but can save money down the road. To understand why this process is so resource intensive, we need to know what goes into such a project.
Data models are only as good as their underlying data. The process of developing those data – identifying some lead service lines and mapping them — is expensive and time-consuming. The rule of thumb in data science is that at least 80% of the work is cleaning data. Modeling water lines is no different. Much of the data needed for this effort is in paper records, is dated, and may not be terribly reliable. Before any utility can build and start to use a model, there must be a data audit. The purpose of a data audit is to identify what data a utility has and to create a sole source of truth. Some of the data sources include building records, building codes in place at various times, permits, and work orders. First, utilities must identify the authoritative data sources and put standards in place so that any newly collected data gets added in the right way. This job is critical to building a lead service line inventory. Most utilities will need to invest in outside help to complete such a large job. A data audit will lead to an ongoing process of collecting and updating data.
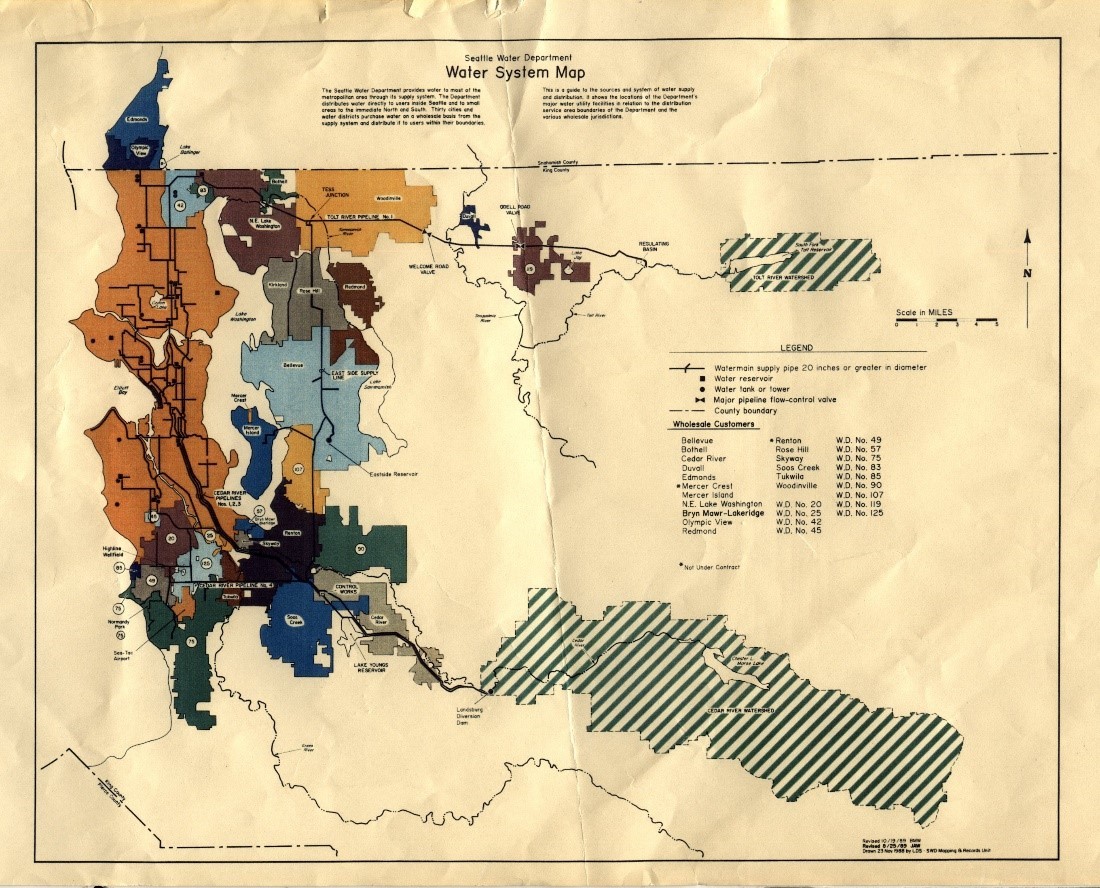
Photo credit: Seattle Municipal Archives, CC BY 2.0 <https://creativecommons.org/licenses/by/2.0>, via Wikimedia Commons
Digitizing these data and linking it to other geographic information can be extremely valuable and will serve as the basis for an effective data model. Models use massive amounts of data to make decisions. For example, a collaboration between Blue Conduit and Harvard’s Data Science program describes how they leveraged an XGBoost model to identify lead service lines in Flint, Michigan. XGBoost is one form of decision tree modeling, where the model “learns” which combinations of variables are likely to contribute to a certain known result, such as presence of a lead service line. The model can then predict the presence of lead service lines in unknown areas if the same underlying variables are available for it to use in decision-making. These decisions can be visualized with variable combinations branching like an upside-down tree. Data characteristics like zip code help the model predict whether a pipe is likely lead or not lead. As more data is fed into the model, that model makes improved predictions that are more robust and reliable.

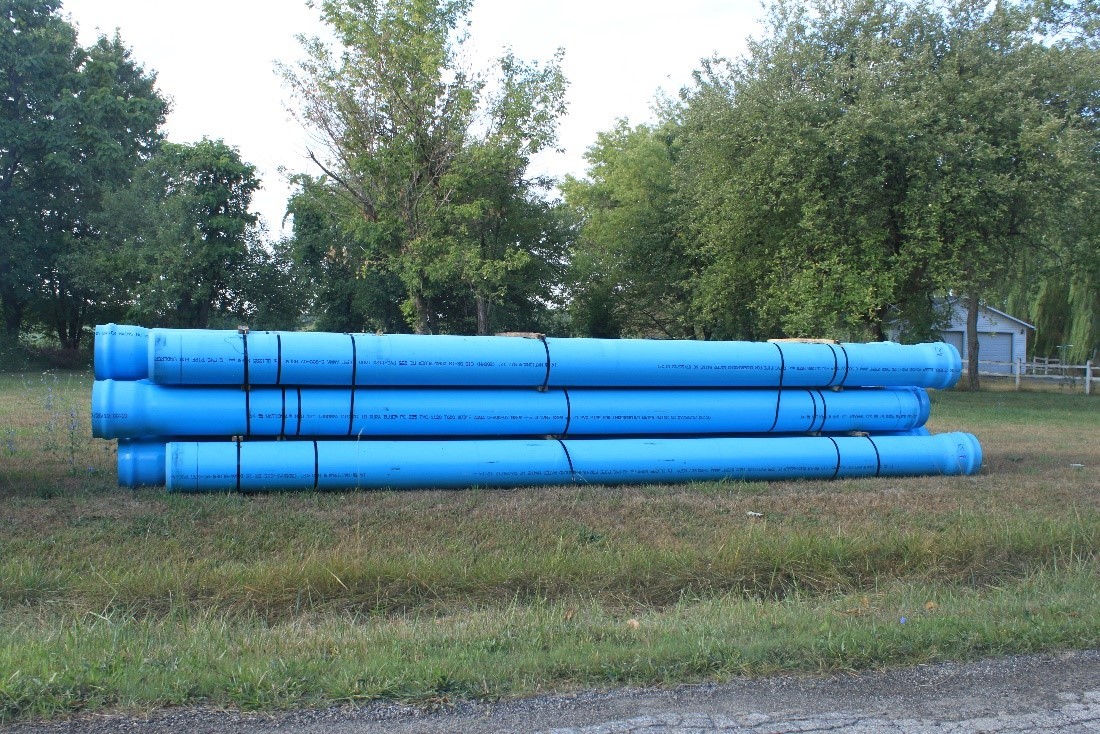
Photo credit: Jeremybeauchamp, CC BY-SA 4.0 <https://creativecommons.org/licenses/by-sa/4.0>, via Wikimedia Commons
Importantly, a data model predicting the likely and unlikely presence of lead service lines will not complete rule requirements alone. When put into GIS (Geographic Information System) and refined, what that model does is give a visual of what data has been collected and what remains to be found, which can lead to efficiencies that help minimize costs overall. For example, data from other sources, like the United States Census or local community groups, can help identify which vulnerable populations are most likely to have lead service lines. Connecting data sources can also suggest which vulnerable populations have the most missing data. The resulting maps from such modeling can help utilities prioritize areas for inventories and define an effective outreach strategy to fill data gaps and help better meet needs across the utility’s service area.
Linking a lead line data model with a utility’s Capital Improvement Plan offers even more efficiency in terms of financial investment. Deciding which capital projects to prioritize first is a complex process. Capital Improvement Plans list needed projects and explain priorities. A utility should combine lead service line inspections with other projects as much as possible to help reduce costs. If the street is already being disturbed, the utility can collect additional data to feed back into the model for future predictions. Utilities can also use the combined information to target outreach and build community support for lead service line investigations and replacement. When Capital Improvement Plans are mapped, that map becomes an excellent tool for communicating with customers. These plans can help explain what projects are being funded now and why, as well as how these projects will benefit customers.
Utilities will have to make the financial investment of conducting lead line inventories to comply with the Revised Lead and Copper Rule. However, investing in data modeling and using those models to leverage investment into previously identified capital projects can help minimize costs and maximize returns.
Need technical assistance? The UNC Environmental Finance Center is here to help!
The Environmental Finance Center at UNC Chapel Hill offers free one-on-one technical assistance for small water systems. If you have an interest in our support, fill out our interest form here or contact efc@unc.edu.
Visit https://efc.sog.unc.edu/technical-assistance/ to read more about technical assistance.