
The Old EFC Affordability Tool
Seven years ago, the Environmental Finance Center at the UNC School of Government (EFC) debuted its Excel-based water and wastewater rates assessment tool. The tool guided utilities to assess the relative affordability of water and wastewater rates on residential customers using multiple economic characteristics. This tool has been used by the EFC during technical assistance (TA) visits to communities and requested by utility managers and local officials all over the country.
This original version of the tool required users to look up American Community Survey (ACS) info on the Census Bureau’s advanced search page and input selected economic characteristics onto the Excel sheet. Entering this data allowed the tool to calculate indicators of affordability and show the results in the form of graphs and tables.
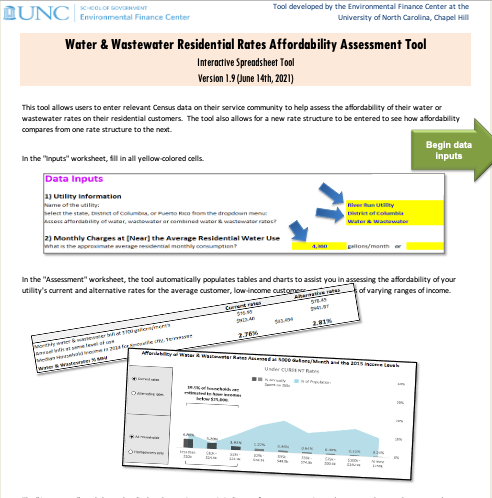
While the acts of finding and entering data were designed to only take a few minutes, feedback from utility managers noted this could sometimes be a cumbersome process, taking up to 20 minutes to complete. With the development of more recent time-saving technology allowing census data to be gathered and delivered to the user, the EFC worked on developing a new version of the tool that would offer a more accessible user interface. The new and improved Affordability Tool can display socioeconomic data for any Census Place in the U.S., and it shows the impact of water and wastewater charges on a range of customers based on income class.
Running Through the New Tool
The new Affordability tool, which can be found here, begins with an Instructions page, which contains a detailed description of the information contained within each tab. Once the user is comfortable with the instructions, they can quickly move on by clicking the next page button at the bottom of the screen or by clicking on the input button at the top of the page. The Input tab contains an interactive interface that allows the user to enter both location and rates information. First, users select the state where their utility is located from a dropdown menu. They can then click on a county, followed by the Census Place their utility serves. Census Places are geographies defined by the U.S. Census Bureau (e.g., municipalities, cities, towns, villages, and boroughs).
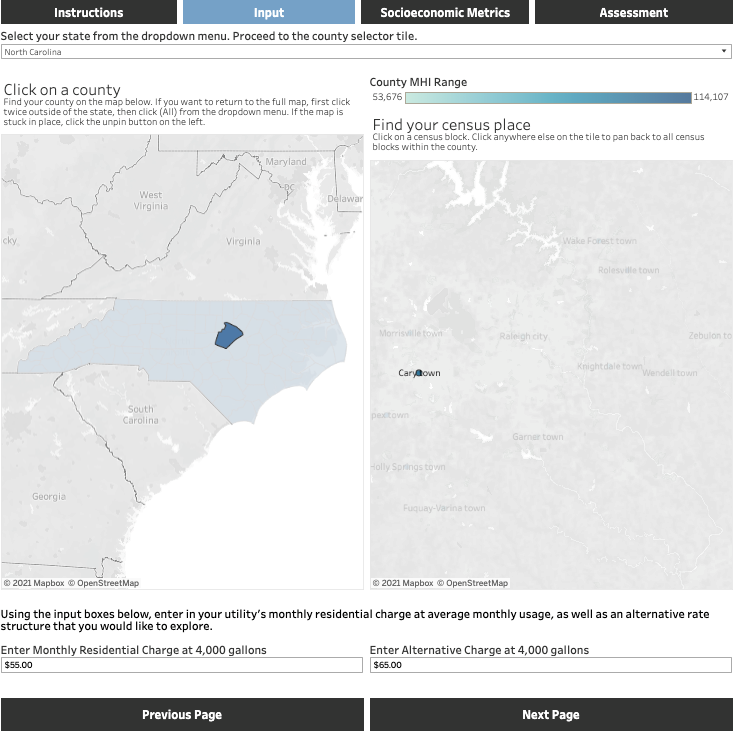
Underneath the geographic selection tiles are boxes to enter the utility’s current combined residential water and wastewater charges at its average monthly usage by customer. Current charges are what the customer currently pays, while alternative charges can demonstrate rate changes that the utility is considering. We recommend putting in a number that represents average customer charges. Each utility has a different average customer charge, but a typical range is between 4,000 and 6,000 gallons per month for a household.
The “Next” button takes the user to the Socioeconomics Metrics tab, which includes additional data related to affordability:
- Median Household Income (MHI)
- % of Households Below the Poverty Line
- % Unemployment
- % of Households on Social Security
- % of Households on other social safety net programs, such as Supplemental Security and SNAP benefits
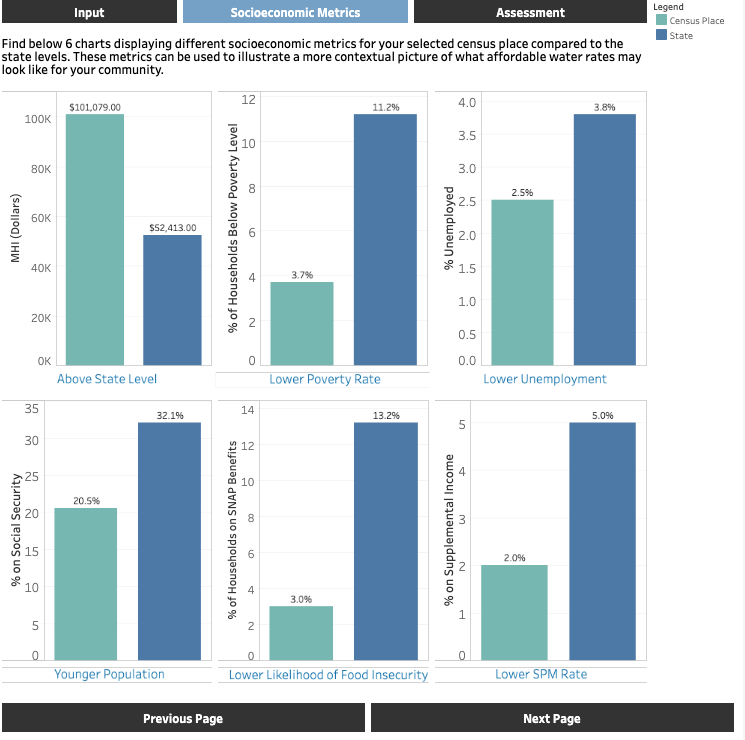
These metrics allow users to understand affordability from a broader perspective by providing more context about a community. For example, an aging population may indicate a future population decline with reduced revenue from rate charges. For communities considering implementing affordability programs, economic information such as levels of unemployment or reliance on social safety net programs can guide decisions about qualifications for reduced utility rates. Additionally, the user can see how each of these measures compares to the state average.
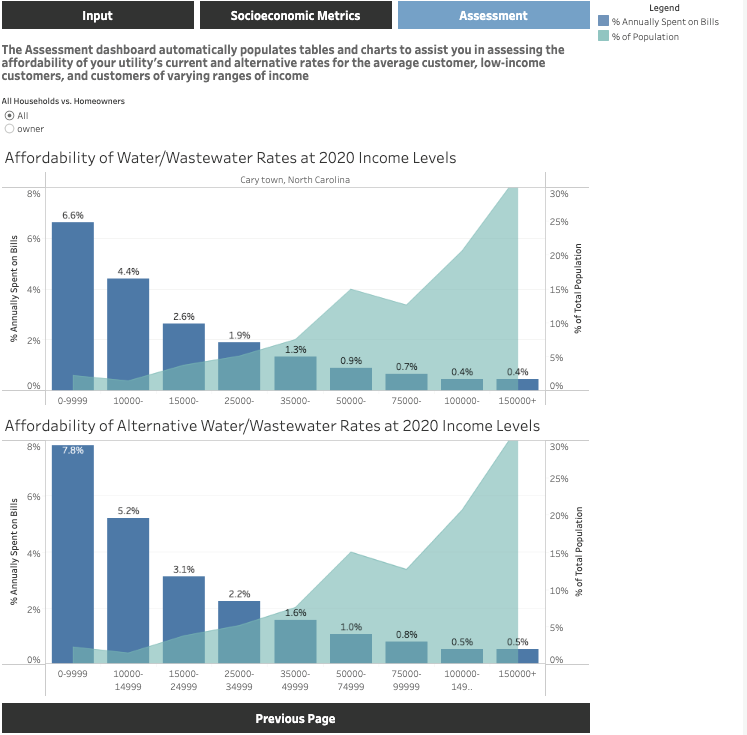
The final tab, Assessment, shows current rates and rates under consideration side-by-side, allowing a direct comparison of how different charges impact lower and higher income customers. Also included on this page is a toggle that allows the user to alternate between information specific to all households and to owner-occupied households. The owner-occupied distinction excludes renter-occupied units which typically have water bills paid for and tacked onto the rent by the property owner.
The Assessment page uses information about income and benefits from the American Community Survey. Income groups are broken into bins, shown along the x-axis of the graphs, and the tool calculates the average bill as a percentage of the upper limit of each bin.
What To Know About the Data
Using the most recent available census data from 2019, the tool’s goal is to give utilities a way to quickly see how particular rate decisions might impact all of their customers, not just customers with the average income. It is worth noting that there are known problems with using MHI as an indicator of affordability. Historically, the most common method of presenting affordability metrics for a specific water utility is to calculate the percentage of the MHI of a community that goes to pay for water and/or wastewater services on an annual basis. This measure is typically one of the benchmarking dials on the EFC’s Water and Wastewater Rates Dashboards. However, by definition, half of the households in a community will have an income less than MHI. Because these households have smaller incomes than the median household, they potentially face much greater affordability challenges.
Like its previous version, the Affordability Tool can help water systems make more informed decisions regarding rate changes. Ultimately, individual water and wastewater systems providers must decide if their rates are affordable. There is no accepted national standard for the affordability of water and wastewater service. Explore the new Affordability Tool for yourself and help guide other water utility managers to do the same by visiting and sharing the link below.
Link to the New Affordability Assessment Tool
Additional Resources on Affordability Metrics
-
Blog Post: Percent MHI as an Indicator of Affordability of Residential Rates: Using the U.S. Census Bureau’s Median Household Income Data
-
Blog Post: The Increasing Need to Address Customer Affordability
-
Blog Post: Understanding the Financial Position of Households Using the American Community Survey
2 Responses to “New Affordability Tool Helps Utilities Explore Water and Wastewater Rates”
William Hughes
I look forward to using your application.
Denise Schmidt
Thank you very much for this fantastic upgrade. User friendly is such an important feature of any tool. It makes a huge difference on whether people will use it or not. Well done!