What is the Georgia Water & Wastewater Rates Dashboard?
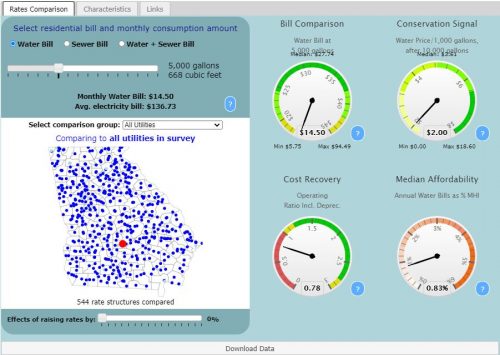
This interactive Rates Dashboard is designed to assist utility managers and local officials analyze residential water and sewer rates of Georgia's utilities against multiple characteristics, including utility finances, system characteristics, customer base socioeconomic conditions, and geography. In 2019 the EFC and the Georgia Environmental Finance Authority collected and analyzed water and sewer rate structures for 521 public service providers in GA.
Comparison Groups
July 2019 residential water, sewer, or water and sewer combined rates for 521 utilities across Georgia can be compared with:
- All other utilities in the State
- Utilities of the same size,
- Utilities with the same revenue generation,
- Utilities in the same watershed,
- Utilities with the same water source,
- Utilities with the same rate structure,
- Utilities serving communities with similar median household incomes,
- Utilities with the same ownership type,
- Utilities in the same Water Planning Region,
- Utilities within 25 miles,
- Utilities within 50 miles, and
- Utilities within 100 miles
Key Financial Indicators
The following measures for the selected utility are compared to key indicators or to the utilities within the selected comparison group:
- Monthly water, sewer, or water and sewer combined bill for the selected consumption amount,
- Monthly bill for as % Median Household Income for the community,
- Conservation pricing signal, and
- Ratio of operating revenues to operating expenses (when available).
You can compare the monthly bill charged for any consumption level from 0 gallons/month to 15,000 gallons/month, at 1,000 gallon intervals. You can also raise rates by up to 100% and observe the (hypothetical) effects on the utility's rates, revenues and rate affordability. The local area's basic cable monthly bill is added for comparison.
In addition, system financial health and customer demographic profiles are provided for utilities where data are available.
Annual Summary Report
A short report summarizing the rates, rate structures and trends currently in use across the State of Georgia. The report answers frequently asked questions about what utilities are charging, their rate structure designs, how rates have increased, affordability and financial sustainability of GA utilities.
Utility Rate Sheets
View a copy of your utility's rate sheet.
Tables of Rates and Rate Structures
Data tables that list all utilities' residential and non-residential water, wastewater and residential irrigation rate structure details as well as the monthly-equivalent bills computed at different consumption levels.
Survey Response Rate:
Year and Month of Survey Publications (survey conducted a few months prior) |
Number of Utilities that Participated in the Rates Survey |
October 2019 | 521 |
October 2018 | 517 |
March 2017 | 471 |
August 2016 | 465 |
June 2015 | 451 |
November 2014 | 452 |
November 2013 | 452 |
December 2012 | 448 |
September 2011 | 466 |
July 2010 | 461 |
August 2009 | 473 |
July 2008 | 477 |
March 2007 | 415 |
Click the bolded words below to learn about different features of the dashboard.
-
Report2018 Georgia Water and Wastewater Rates ReportWed, 05/22/2019Austin Thompson, Annalee Harkins
-
Report2019 Georgia Water and Wastewater Rates ReportMon, 11/11/2019
-
ReportAffordability and Principal Forgiveness in the State Revolving Fund Programs of the Environmental Protection Agency Region 4 StatesTue, 05/01/2018Stacey Isaac Berahzer, Claudia Flores, Jeff Hughes
-
PowerpointBenchmarking Financial Performance, Rates, and Demo of the 2019 Georgia Water and Wastewater Rates DashboardTue, 10/13/2020Shadi Eskaf
-
PowerpointCommunicating Rates And Utility Finance With Elected Officials And Customers for Georgia Water UtilitiesThu, 10/15/2020Stephen Lapp
-
ReportGeorgia Water and Wastewater Rates Report - 2017Sat, 03/31/2018Annalee Harkins
-
PowerpointSetting Rates To Fund Operations And Capital ImprovementsWed, 10/14/2020Elsemarie Mullins
-
TablesTables Of Water And Sewer Rates And Rate Structures In Georgia As Of July 2017Wed, 11/28/2018
-
TablesTables of Water and Sewer Rates and Rate Structures in Georgia as of July 2018Mon, 04/29/2019
Pages
Rates data: Rates data for this dashboard were collected by the EFC in partnership with the Georgia Environmental Finance Authority. Each utility’s rates are standardized to monthly billing and thousands of gallons for the purposes of fair comparison on the dashboard.
Demographic data: The American Community Survey 5-Year Estimates (2013-2017) from the US Census Bureau.
System characteristics, such as number of connections and water source type: Environmental Protection Agency's Safe Drinking Water Information System
Geographic: United States Geological Survey
We strive to include as many utilities in our surveys as possible, maintaining a minimum response rate of at least 80% of rate-charging utilities in each state. If your utility is not included on your state’s dashboard, it may be that a rate sheet was not received during the survey collection period, or clarifying questions went unanswered.
However, by utilizing the “Edit Data or Add Utility” button in the upper right corner of the Dashboard, you can temporarily compare your water rates against the existing utilities on the Dashboard. Please note that data are only available locally and will not be saved within the Dashboard.
Please contact Annalee Harkins. We will do our best to update your rates as soon as possible!
Data can be edited temporarily by utilizing the “Edit Data or Add Utility” button located in the upper right corner of the Dashboard. Please note that data are only available locally and will not be saved within the Dashboard.
Dials such as “Cost Recovery” and “Affordability” rely on supplemental data in making calculations. When supplemental data is not available for a utility, the message is displayed and the dial is blanked out.
Each dial has a “?” button which shows how the dial is calculated, the data used in the calculation, and a brief explanation of the dial’s purpose.
You may download a PDF report of water and sewer rates and rate structures in Alabama as of 2016 here. The updated 2019 tables will be available in February.
For other data questions, please send a request to Annalee Harkins.
Rates Dashboards are primarily funded through contracts with state and Federal governments. If you are interested in a Rates Dashboard for your state, please contact Shadi Eskaf.
Dashboards with annual contracts such as NC and GA are updated approximately the same time each year. Other states are updated on a per-contract basis.
Utilities may send corrections if their rates are incorrectly displayed on the dashboard. These corrections are implemented on a quarterly basis.
Share this on Social Media...