** Please CLICK HERE to open the dashboard in a new tab **
The South Carolina Rates Dashboard has been updated using October 2015 rates.
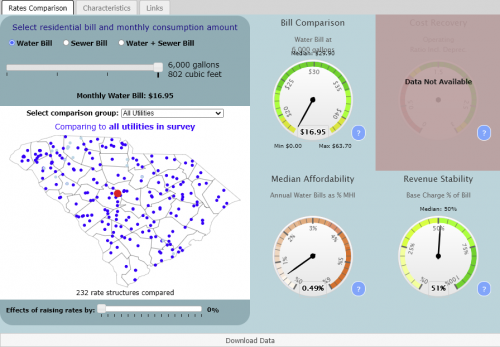
The Environmental Finance Center is pleased to announce the launch of the 2015 South Carolina Water & Wastewater Rates Dashboard. This interactive Rates Dashboard is designed to assist utility managers, finance directors, Board members, state and local officials, reporters, and customers in comparing their residential water and wastewater rates against multiple characteristics, including utility finances, system characteristics, customer base demographics, and geography. Rates data for this dashboard are drawn from the October 2015 residential drinking water and wastewater rates survey conducted by the S.C. Rural Infrastructure Authority's Office of Local Government.
This Rates Dashboard was constructed as part of the Smart Management for Small Water Systems nationwide project of the Environmental Finance Center Network (EFCN). The EFCN is composed of numerous Environmental Finance Centers around the country, including the Environmental Finance Center at the University of North Carolina, Chapel Hill, which created this dashboard. This dashboard was created under a cooperative agreement with the United States Environmental Protection Agency. Additional resources for water and wastewater utilities are provided below.
New look and new functions!
For everyone who is familiar with the Rates Dashboard, you will notice that we have given it a new look and added many new features and functions:
- An easier way to select your utility from the dropdown menu: now you can type in your utility's name.
- Ability to click on and select any utility on the map.
- Tablet friendly format allows you to view the dashboard on your tablet device (e.g. iPad).
- Ability to edit your utility's data. These edits and additions will be saved on your computer until you delete your cookies.
- Ability to add a new utility/rate structure to the dashboard. These edits and additions will be saved on your computer until you delete your cookies.
- Ability to observe the effects of raising rates by up to 100%.
- Much faster load and response times as you interact with the dashboard.
- Numerous other function and aesthetic changes to improve the use and feel of the dashboard.
The South Carolina Dashboard offers the following features:
October 2015 residential rates for utilities across South Carolina can be compared with:
- All other utilities in the State,
- Utilities of the same size,
- Utilities in the same watershed,
- Utilities with the same water source,
- Utilities located in the same congressional district,
- Utilities located within the same regional council of government,
- Utilities that serve communities with similar household income levels,
- Utilities in counties of the same economic tier, and
- Utilities within 25, 50, or 100 miles.
You can compare residential water and sewer bills at 0, 3740, 5601, and 6000 gallons/month.
You can also raise rates by up to 100% and observe the (hypothetical) effects on the utility's rates, revenues and rate affordability.
The following measures for the selected utility are compared to key indicators or to the utilities within the selected comparison group:
- Monthly water/wastewater bills,
- Monthly bill as % Median Household Income for the service community,
- Operating ratio, and
- Revenue stability (what percentage of the currently selected bill is comprised by the base charge).
Tags
Rates data:Rates data for this dashboard are drawn from the October 2015 residential drinking water and wastewater rates survey conducted by the S.C. Rural Infrastructure Authority's Office of Local Government.
Demographic data: The American Community Survey 5-Year Estimates (2012-2016) from the US Census Bureau.
System characteristics, such as number of connections and water source type: Environmental Protection Agency's Safe Drinking Water Information System
Geographic: United States Geological Survey
This Rates Dashboard will only features utilities regulated by the the S.C. Rural Infrastructure Authority's Office of Local Government.
However, by utilizing the “Edit Data or Add Utility” button in the upper right corner of the Dashboard, you can temporarily compare your water rates against the existing utilities on the Dashboard. Please note that data are only available locally and will not be saved within the Dashboard.
Please contact Annalee Harkins. We will do our best to update your rates as soon as possible!
Data can be edited temporarily by utilizing the “Edit Data or Add Utility” button located in the upper right corner of the Dashboard. Please note that data are only available locally and will not be saved within the Dashboard.
Dials such as “Cost Recovery” and “Affordability” rely on supplemental data in making calculations. When supplemental data is not available for a utility, the message is displayed and the dial is blanked out.
Each dial has a “?” button which shows how the dial is calculated, the data used in the calculation, and a brief explanation of the dial’s purpose.
Please send a data request to Annalee Harkins.
Rates Dashboards are primarily funded through contracts with state and Federal governments. If you are interested in a Rates Dashboard for your state, please contact Annalee Harkins.
Dashboards with annual contracts such as NC and GA are updated approximately the same time each year. Other states are updated on a per-contract basis.
Utilities may send corrections if their rates are incorrectly displayed on the dashboard. These corrections are implemented on a quarterly basis.
Share this on Social Media...