“Are our water utility’s rates right?” This is an often difficult question that arises at our workshops and webinars for small water systems, through our direct technical assistance, and which many of our readers may be interested in. While there is no simple answer, we have addressed the issue in a series blog posts on key financial indicators for water systems, including a discussion of conservation signal as a key financial benchmark to consider in rate setting. While the initial answer continues to be “It depends,” another element to consider (among the numerous factors to consider and rank in importance) is revenue stability.
Revenue Stability
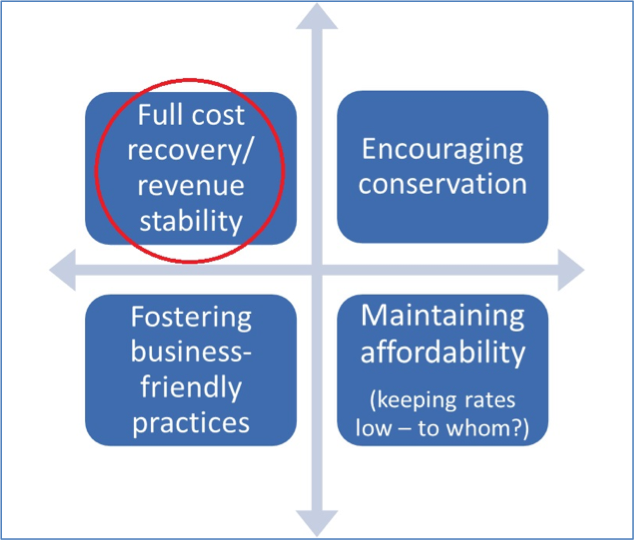
What are your utility’s rate setting objectives? What goals does your utility hope to accomplish for your service area, community, or utility with the rates you have set? The graphic below indicates some of the more common rate setting goals (though it is by no means a full and complete list), and some of the potential trade-offs between them (e.g. higher conservation pricing signals may help to manage scarce source water resources, but may make affordability of water in that range of consumption a bit less affordable). On the upper left, we see an element that is the subject of this post: revenue stability.

Why Should Water Systems Care About Revenue Stability?
Essentially, the question of revenue stability is simple, at least at first glance: Are the rates that you have set generating sufficient revenue for your utility to recover your costs (both operating and maintenance costs, and longer-term capital costs), not only on a day-to-day basis, but also under situations of uncertainty or adversity, such a drought, a disruption to source water supplies (e.g. from an environmental pollution accident), etc? However, this question, about which my colleagues have blogged in a variety of ways, turns out to have a number of twists and turns.
Different water systems have various rate structures, to be sure. In our work around the country, we see flat fee rate structures, uniform rate structures, block rate structures, and many more. But most commonly we see water rate structures that have a base charge (or fixed charge or minimum charge) that the customer will pay every billing period (e.g. monthly), regardless of water usage; plus a variable charge (or volumetric charge or consumption-based charge) that depends upon how much water the customer uses. Frequently, the revenue budgeted by the utility, and thus its rate setting decisions, comes disproportionately from the variable side of the ledger, thus keeping the base charge fairly low (e.g. $10 a month for the base charge). This may help low-income customers who use low amounts of water (senior citizens on fixed incomes often may use only 2,000 – 3,000 gallons of water per month per household, for example) to afford water services.
However, on the expense side of the utility’s budget, a typical water utility will often have a disproportionately high share of expenses that are fixed (e.g. employee salaries, or debt service on loans), rather than variable expenses (e.g. electricity usage or chemicals for water treatment). So what happens if there is a disruption to water sales? Revenues may decline sharply, while expenses decline slightly – assuming a low base charge and most of the revenue coming in from volumetric charges. This can put the utility in a difficult financial position, at least temporarily – or for multiple years, such as in recent severe drought conditions in the western United States.
How Can Water Systems Look at Their Rates from a Revenue Stability Standpoint?
Time and time again, revenue stability has emerged as an important metric in our work with water utilities. As such, we at the EFC are testing a new dial for the future for our online, interactive, water and wastewater rates dashboard tools: the Revenue Stability Dial.
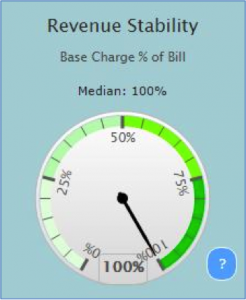
The Revenue Stability dial for our dashboards (still under development) will help utilities get a quick snapshot of their revenue stability and benchmark against peer utilities. Looking at any of our water and wastewater rates dashboards, such as the North Carolina one, the user can select a volume of water usage from lower amounts (e.g. 0 gallons per month) to higher amounts (e.g. 15,000 gallons per month). Given a fairly typical water rate structure (a base charge, perhaps with some consumption allowance, plus a volumetric rates component), if the user selects 0 gallons/month of water usage, the base charge would comprise 100% of the total charge for that month – since that’s all that the customer is getting billed for:

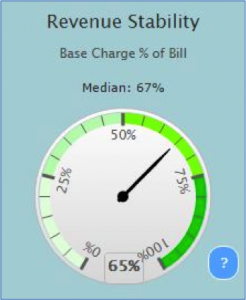
Of course, in a typical month, a customer will use a non-zero amount of water! So now let’s take a fairly low-usage scenario, such as 500 cubic feet, or 3,740 gallons per month:

In this case, the base charge, which is $15.25, comprises 65% of the total monthly bill of $23.50. And if you look above the dial itself, you’ll see “Median: 67%.” This means that, for the peer group of utilities in the survey, the median percentage is 67%. Put another way, the typical (median) customer’s base charge, at 500 cubic feet per month of consumption, comprises 67% of the total monthly bill. So our example utility is only slightly below that percentage. Now let’s look at a somewhat more “average” amount of usage per month for a southeastern state, namely 6,000 gallons per month:

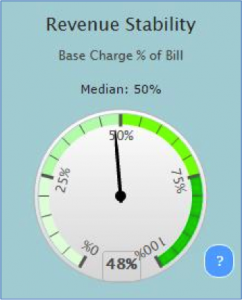
Now the percentage for our example utility has dropped to 48%, with a peer group median of 50%. So what does all of this mean?
Revenue Stability and Potential Trade-Offs
Let’s say your local government owned water utility is currently experiencing, and has for years, a shortage of revenue from water sales. The utility is operating the drinking water enterprise fund at a deficit, subsidizing it from the general fund (which is certainly not a best practice, under normal conditions). The utility is considering a rate increase. Should proportionately less of that rate increase go into the base charge, and more of it into the volumetric rates, to help maintain customer affordability? Or should proportionately more of the proposed rate increase go into the base charge, helping to increase revenue stability in the face of uncertain future water sales? Probably the answer will need to be some combination of both of those concepts, and other considerations as well.
Our North Carolina water rates dashboard allows users to input a new utility rate structure into the dashboard, simulate potential rate changes or increases, and examine the effect of these changes on key financial benchmarks. In the future, when we roll out the Revenue Stability Dial as well, you will be able to look at the percentage of revenue coming from the base charge at different usage amounts (e.g. 5,000 gallons/month), and to consider if this falls in a range that is sufficient to assist with revenue stability, or if it is not.
In the meantime, we would love to see any questions, comments, or discussion you might wish to post here on the new dial that is under development – a de facto online focus group!
These are difficult questions for rate setting staff and governing boards to consider. But the question of revenue stability will probably need to be in the mix even more in the future, as droughts, water efficient equipment, and climate change resiliency become ever greater considerations.

