This week of Thanksgiving, we at the Environmental Finance Center (EFC) are grateful for many things, including work in an interesting field and the opportunity to assist communities with the challenges of sustainable environmental finance. But not all Americans are so fortunate during this holiday time, including when it comes to affording needs such as drinking water, wastewater, electricity, stormwater, and other environmental services.
Declining National Median Household Income, 2000 – 2013
One way into the affordability discussion is to look again at our old friend, Median Household Income (MHI). As shown in this recent report from Sentier Research, based upon the Current Population Survey (CPS), the MHI for the country declined 4.4 percent since the beginning of the economic recovery in June 2009. While national MHI has recovered somewhat since a 2011 low point, adding this post-recession MHI decrease to a 1.8 percent drop during the Great Recession, annual MHI is now 6.1 percent below December 2007 levels. As the report states:
“After adjusting for changes in consumer prices, median annual household income declined during the officially-defined recession from $55,480 in December 2007 to $54,478 in June 2009. During the “economic recovery”, as the unemployment rate and the duration of unemployment remained high, median annual household income continued its decline, reaching a low point of $50,722 in August 2011. As of June 2013 median household income had recovered somewhat to $52,098 (seasonally adjusted estimates).”
Even worse, Sentier estimates from January 2000 to today, MHI is now lower by a total of 7.2 percent. (Income amounts in the report are before-tax, presented in June 2013 dollars). This makes everything in our economy more difficult to afford, including environmental services. These trends got me wondering what the overall picture looks like of the affordability of environmental services where I live, in Durham, North Carolina.
Affordability of Environmental Services: Water and Wastewater
In looking at combined drinking water and wastewater bills in Durham for residential customers using 5,000 gallons/month, we see from the EFC’s North Carolina Water and Wastewater Rates Dashboard that a monthly bill is $54.48. A year of bills, divided by Durham’s MHI, is 1.36% of a median household customer’s gross annual income. This sounds fairly affordable. Indeed, Durham’s MHI of $48,241 is above the statewide average, $46,450. However, estimated poverty rate is higher: 19.45% in Durham versus 16.80% (N.C.) and 14.9% (U.S.). Which reminds us that affordability of water/wastewater is more difficult for lower-income households. Let’s take a closer look at that.
Using the EFC’s Water and Wastewater Rates Affordability Assessment Tool (AAT), we get a more nuanced look at affordability of water/wastewater services across different population sub-groups. Using the dashboard, we look up bills for 5,000 gallons/month of water/wastewater and enter them into the AAT. Then we input some socioeconomic data (including MHI and non-MHI factors) on Durham from the U.S. Census Bureau’s American Factfinder website.
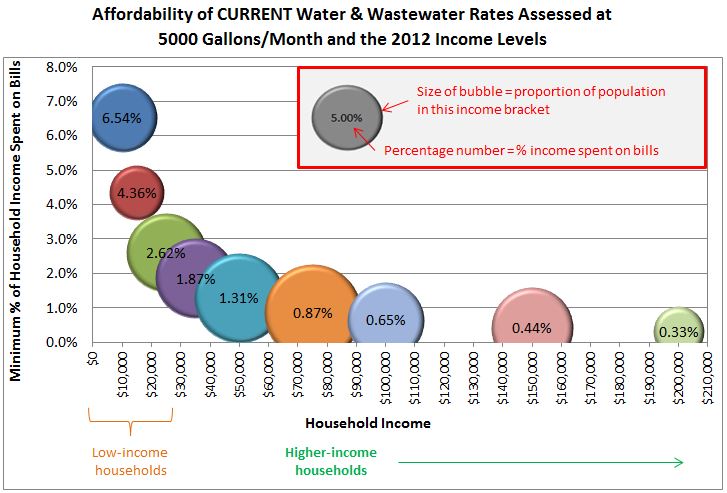
As we can see from this chart from the Tool, in the lowest income bracket ($10,000 or less annual MHI), households spend over 6.5% of their gross income on water/wastewater bills at 5,000 gallons/month. The next lowest income bracket is also several times higher than what the median customer pays (1.36%). The following table gives us another look:
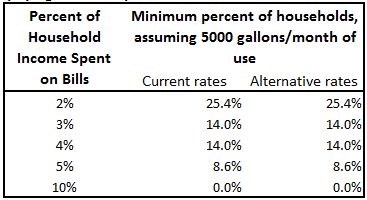
Hence 8.6% of customers pay 5% or more of annual household income on water/wastewater bills; and 14.0% of customers pay 4% or more. These are significant percentages. However, when looking at other socioeconomic indicators, and not just MHI, customers and citizens in Durham are sometimes better off, sometimes worse off, than the state/country. This table shows the mixed picture:
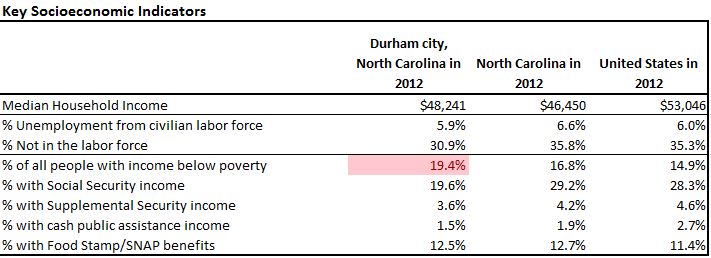
Hence the Durham unemployment rate is slightly better than in the state/country, yet the poverty rate is higher. The percentage of people on SSI is lower than the state/country, but the percentage on food stamps/SNAP benefits is between the national and statewide averages. (For more on this, consider attending our webinar on “Customer Affordability Considerations in Water Rate Setting,” on December 9, 2014; to register, click here.)
Affordability of Environmental Services: Electricity and Stormwater
Water and wastewater are not the only environmental services we use. As a Durham residential electricity customer, I use Duke Energy Progress. Looking up the rates on the EFC’s 2014 North Carolina Electric Rates Dashboard, for a residential home using 1,200 kWh/month, monthly bills are:
$136.54 = bill (warm weather rates)
$124.54 = bill (cool weather rates)
$130.54 = average of these two
Durham homeowners also incur stormwater management fees to protect the watershed and reduce erosion. The EFC has a North Carolina Stormwater Utility Fees Dashboard, though the rates are from fiscal year 2011-12. Modeling my home with residential impervious area of 3,000 square feet, and looking up current Durham stormwater fees, the monthly charge is $6.75.
Of course, a given home may also pay for solid waste services (garbage, recycling, yard waste), natural gas, fuel oil, etc. For simplicity, we’ll omit these and assume my home is all-electric.
Affordability of Environmental Services: Overall Annual Picture
Altogether, we conclude the following about annual affordability of environmental services:
$653.76 = water/wastewater cost (60,000 gallons/year)
$1,566.48 = electricity cost (14,400 kWh/year)
$81.00 = stormwater fees (2,000-4,000 sq-ft of impervious area)
$2,301.24 = annual total cost
$48,241.00 = Durham annual MHI
4.75% = percentage of annual gross income for a median household
$24,999 = annual household gross income for a 37th percentile household
9.21% = percentage of annual gross income for this household
Thus, a median income Durham household would spend just under 5% annually on these environmental services. But a 37th percentile income household (top of the low income group of households in our AAT) would spend almost twice that much on a percentage basis.
Thanksgiving and Environmental Services
This Thanksgiving, I am grateful for clean drinking water from my tap; access to sewer services (just last week the U.N. stated for World Toilet Day that 2.5 billion people worldwide lack access to improved sanitation); a community that is taking steps to deal with stormwater issues; and access to electricity and all of the marvels it brings (note the World Bank estimates that over 1.2 billion people worldwide are without electricity).
I am fortunate to live in a place like Durham where all of this is possible, and to be able to afford these services. Yet in cities, towns and rural areas across America, many remain in economic distress; and all of us are affected by the longer term MHI decline.
In all of this, we have opportunities to learn more about poverty in our communities, to get involved personally or professionally to address these problems, and to do what we can to make a difference. As someone recently said to me, grab “the near edge of the tapestry” and pull on a piece that each of us can work on. In this time of Thanksgiving, perhaps we can all be thankful not only for what we have, but also for the opportunities that are before us to serve others. Happy Thanksgiving!
One Response to “Thanksgiving amidst Affordability Challenges for Environmental Services”
Tobin Freid
This is a very interesting analysis and one that should be an important part of policy discussions. The City of Durham recognizes how utility bills affect affordability. We are building all of our affordable housing, including the new Southside Developments, to meet Advanced Energy’s Systems Vision criteria. Systems Vision certifies homes to meet strict energy, water, and healthy homes criteria and then guarantees low monthly utility bills. It would be great to see more developers adopt Energy Star, Systems Vision, and other third party certifications when building homes.
This analysis also shows the importance of efficiency and conservation programs aimed at lower-income populations. There are programs out there, but resources are always spread so thin. Often there are restrictions on funding that block out households that are above 200% of the poverty level, about $47,700 for a family of 4. This is understandable considering the desire to target scarce resources towards the neediest). However, I hear from a lot of people who are above that threshold but who are still struggling to make ends meet and could certainly use some help with weatherization and water conservation.
I am a bit curious as to the assumptions you made about the monthly water usage. 5,000 gallons a month seem very high to me. It would put the household into the 3rd billing tier, which is almost 10% higher rate than tier 2. 5,000 gallons a month is almost double what my household of 4 uses in a month.
I am very thankful for the work that y’all do over at EFC and wish you all a Happy Thanksgiving!