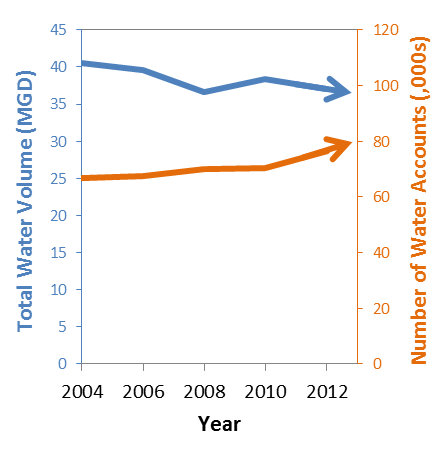
Almost two years ago, we wrote a blog post revealing that average residential water use is declining in the State of North Carolina. Similar trends have also been identified in other states and across the country, driven by several factors. It turns out; it’s not just average residential water use that is declining. Despite growing service populations, many utilities have noticed that total demand is falling.
In analyzing national data on water use for the recently published Water Research Foundation report on Defining a Resilient Business Model for Water Utilities, we noticed that 60% of water utilities that participated in the 2006 and 2012 national AWWA-RFC Water & Wastewater Rates Surveys indicated that they sold less water in 2012 than they did in 2006. This includes all water sold to all types of customers – residential and non-residential – and was despite the fact that 81% of the utilities reported an increase in total number of accounts served between those years. For most utilities, service population increased, but not fast enough to offset the decline in average water use.
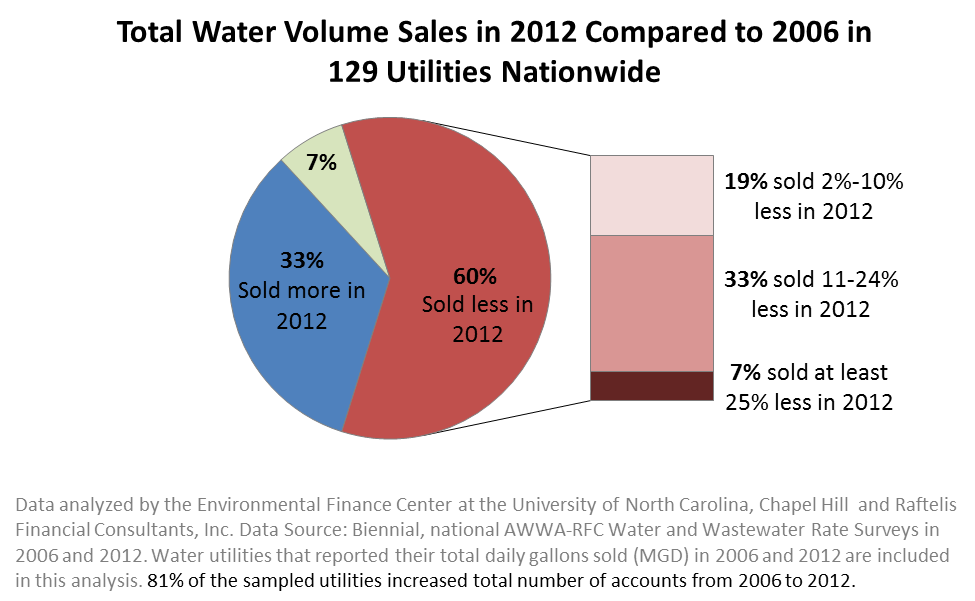
One pie chart alone may not prove much, though. Perhaps 2012 was simply a wetter year than 2006, driving down demand in that single year because residential and non-residential customers irrigated less.
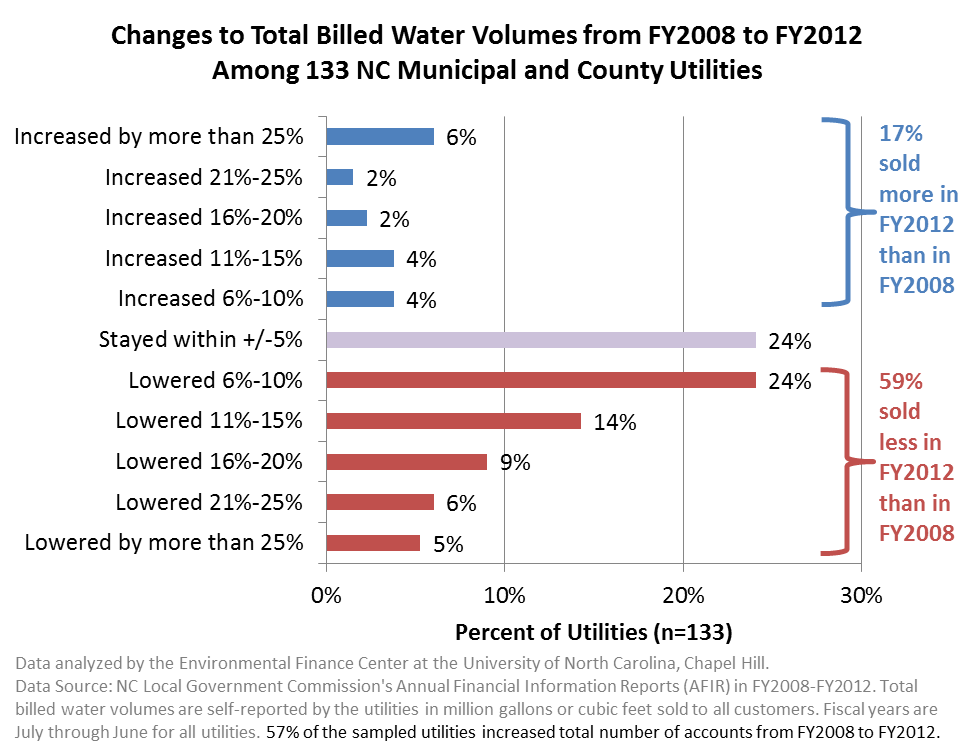
We explored this phenomenon further by analyzing a different data set more comprehensively. All municipal and county water utilities in North Carolina have been reporting their total water sales annually to the Office of the State Treasurer (Local Government Commission) since FY2008. From these data, we identified 133 local government utilities that reported total water sales consistently every single year between FY2008 and FY2012 (Fiscal Years are July through June for all local governments in North Carolina). The 133 utilities in the sample ranged in size from fewer than 100 accounts to more than 164,000 accounts.
The trends in this sample of utilities in North Carolina match what was observed in the national data set. The data first revealed that average residential demand declined over time in North Carolina, confirming the results of the first blog post even though this was using a different data set. In regards to total billed volumes, 59% of the utilities sold less water in FY2012 than they did in FY2008. Only 17% of utilities saw a higher total demand in FY2012, despite the fact that 57% of the utilities had more customers in FY2012 than in FY2008. Few utilities even saw a massive decline in water use: 11% of the utilities “lost” at least one-fifth of their total demand in FY2012 compared to five years prior.
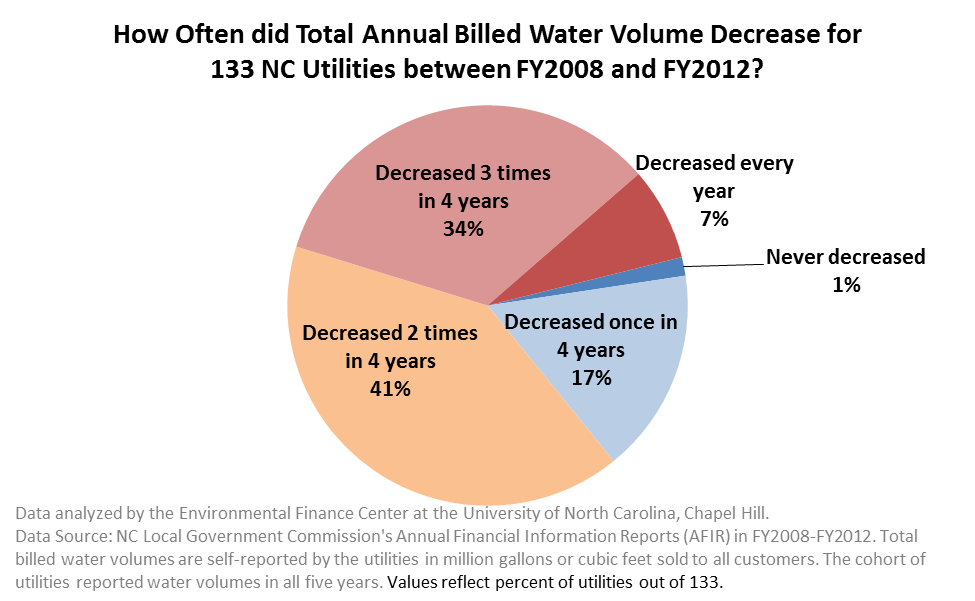
Declining water sales from one year to the next was prevalent among these utilities throughout this time period. Between FY2008 and FY2012, 41% of the utilities sold less water than in the previous year in at least three out of four years, demonstrating a consistent trend of usually-declining demands. By contrast, only 18% of utilities had more growth years than decline years, and only two utilities never had a single decline in total demand in those years.
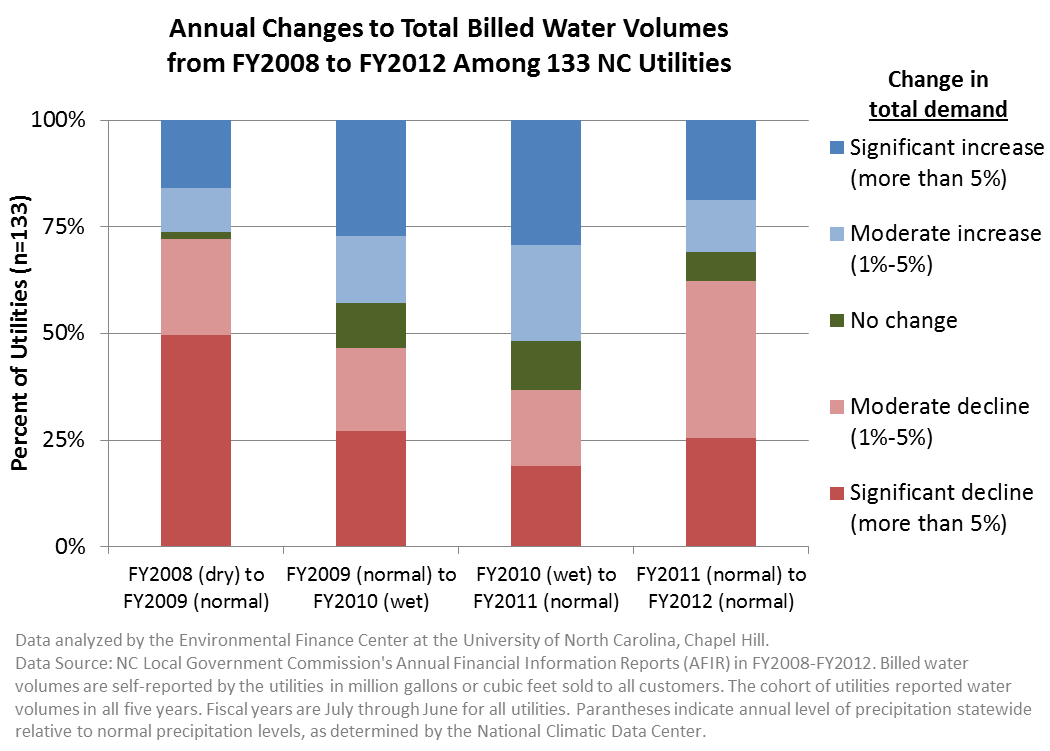
Digging deeper still, we notice that changing weather patterns may explain at least part of the changing demands. According to the National Climatic Data Center, precipitation levels across the State of North Carolina were much below normal in FY2008 (one of the droughts of record in the state), above normal in FY2010 (wet year) and near normal in all other years. Since water demand typically decreases in North Carolina as precipitation increases, we would expect total demand to significantly decrease in FY2009, decrease again in FY2010 and then increase in FY2011. This is generally what the 133 utilities witnessed on aggregate as shown in the graph below. However, even in FY2011 when water demand generally increased because precipitation decreased, a large number of utilities still experienced a decrease in total water demand. It is important to note that between FY2011 and FY2012 (two “normal” precipitation years), more than 60% of the utilities had a decline in total demand, re-emphasizing that the general trend for the majority of the sampled utilities was a decline in total demand. Weather alone does not explain all of the changing demand patterns.
Regardless of the drivers of changing demands, of which there are many, the implications of declining total demands are significant. Water utilities have a complicated relationship with customer demands. On one hand, declining demands is great for water resources management, increasing the potential supply for new customers, avoiding costly expansions, and protecting environmental habitats. On the other hand, lower demand equals lower revenues, while large fixed costs remain unchanged and must still be paid. If utilities are projecting growth in demand and instead are witnessing a decrease, revenue shortfalls will result. More worryingly, utilities that expand their water systems based on old demand projections and then experience a decrease in total demand instead of an increase will have taken on new debt and capital costs to pay for capacity that may not be used for many years, at the same time when revenues may also be suffering due to declining demands, intensifying their financial difficulties.
Note that we only analyzed data for about 130 utilities in the national and in the NC data sets. These are not statistically representative samples of all utilities. Water use trends may be different in other regions of the country. Even within these two samples, there are several utilities that saw significant increases in demand while others had declines. It would be wrong to assume that most utilities in the country are experiencing declining demands without further evidence. What is clear from this analysis, though, is that many (not all) utilities may be experiencing declining total demands and should be planning for the financial consequences as a result. Every utility should periodically examine its most recent water use trends and adjust or update their demand projections in order to set appropriate rates and re-assess the need for system expansions.
Shadi Eskaf is a Senior Project Director for the Environmental Finance Center at the University of North Carolina, Chapel Hill. Data cleaning and analysis was performed by Sarah Royster and Shadi Eskaf.
5 Responses to “Even Total Water Demand is on the Decline at Many Utilities”
Unrequited Demand in a World of Fixed InfrastructureEnvironmental Finance Blog
[…] of communities across the country is little more subtle, a little more passive aggressive. Water customers across the country are pulling away, demanding less from the utility. And maybe this isn’t such a bad thing, as long as the […]
Less Common Base ChargesEnvironmental Finance Blog
[…] of utility expenses are fixed in the short term and require a stable revenue source to pay for them despite decreasing demands. The most common practice is for utilities to set a constant base charge for each customer class or […]
Base Charge Battles « Environmental Finance BlogEnvironmental Finance Blog
[…] much more revenues from the variable charges than the base charges, exposing their revenues to declining water demands. However, most of the utility’s costs are fixed, and some utilities are examining ways to […]
Casey Wichman
But, Shadi– what about prices! What happened to rates at those utilities over the 2008-2012 period? Consumer demand is generally inelastic (I.e., as water rates go up, quantity demanded goes down by a slightly less proportion) and I know prices generally rose for most utilities in your sample over the time frame. How much can be explained by prices? Water efficient technology adoption? Changes in preferences for in the face of scarcity?
Shadi Eskaf
Casey, thank you for your comment. Absolutely, rates have gone up significantly in that time period. I wrote a blog post describing how quickly rates have been rising for nearly 2,000 utilities across the country. Rates going up is one of several factors that may be contributing to declining demands (certainly is for declining average demands). There are other factors including weather, changing behaviors, losing commercial/industrial customers, improved water efficiency, etc. – many of which you also listed. This blog post is focused on showing the net result of changing demands and not on explaining all of the reasons behind these changes (that was described in another blog post that is linked above). I only picked on precipitation to show one example of why demands may be declining, but it is certainly not the only reason.