This is the third post in a three-part blog series on data management. This post will focus on user-centered design of Environmental Finance Center tools.
Post by Julia Cavalier, Senior Research Specialist at UNC EFC and Robin Haley, Graduate Research Assistant at UNC EFC
As mentioned in the first and second part of this blog series, If you build the data platform, will they come? and Behind the Scenes of the Revenueshed Tool, the Environmental Finance Center (the EFC) project designers have to know the users, identify purpose of the project goal, and collect the data that exists to support this goal. With this comes documentation of the project, because without context it will be difficult to replicate actions and hard to understand from a user’s perspective. The EFC is revising some existing tools. The first step in revision is to understand and document how tools are used. The second step in revision is to set goals for what new tools should do. The goals will become the foundation of tool redesign.
Which EFC tools are being redesigned?
The EFC is redesigning the following tools:
- Water and Wastewater Rates Affordability Assessment Tool (the “Affordability Tool”). This tool shows the impact of rates on different customers. It looks not just at median household income but also other impacts on affordability like poverty rate.
- Financial Health Checkup Tool. This tool gathers input from five years of utility financial data and shows how key financial indicators compare to benchmarks.
- Rates Analysis Model. This tool lets a utility explore different rate changes – what would happen if I increased rates, added blocks, or changed the base or volumetric charges within some blocks?
EFC staff use tools technical assistance visits, or TAs. During TAs, EFC staff collect financial records from small utilities and input them into tools. EFC staff walk through the tools for utility staff. Utility and EFC staff may also present tools to the utility board.
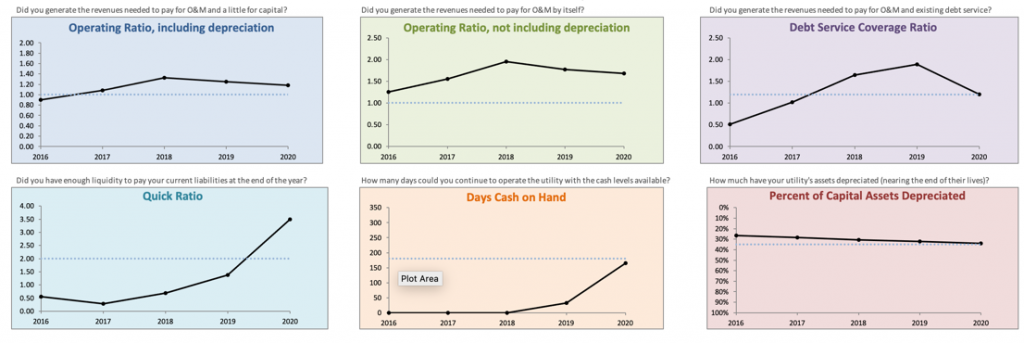
Tool designers have interviewed EFC staff to understand how they work with small utilities. EFC staff have found that the charts that resonate most with utility decisionmakers are operating ratio (with and without depreciation) and days cash on hand, shown below.
Financial values compared to key financial indicators from the Financial Health Checkup Tool.
How do we understand and document tool use?
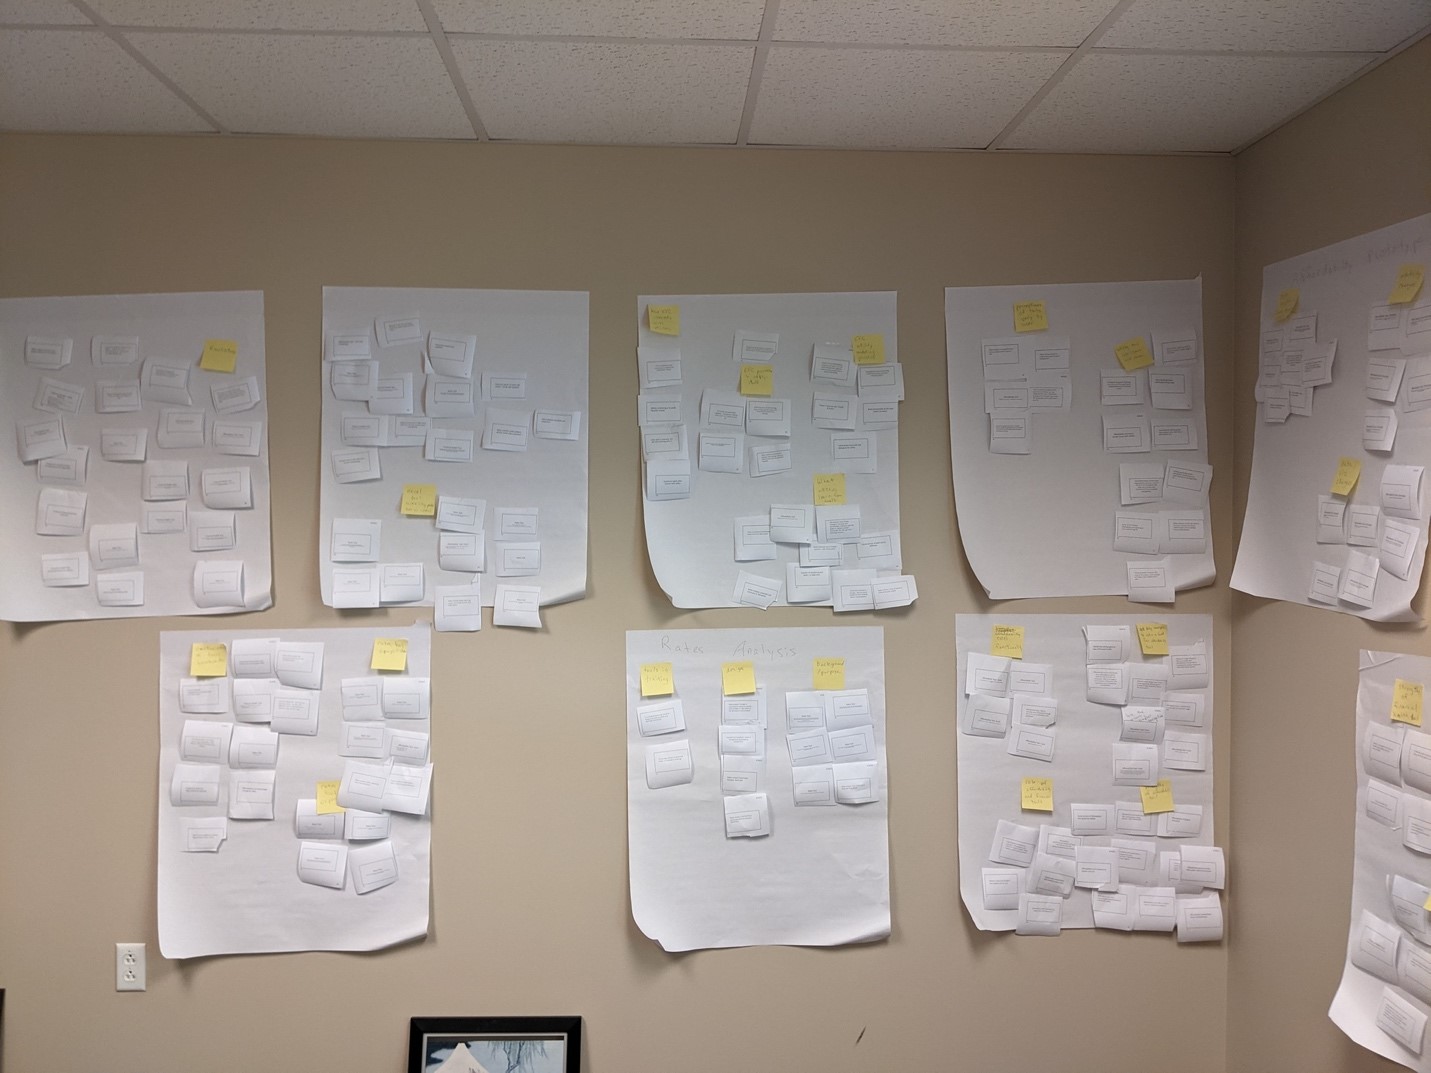
The process of consolidation involves organizing information gained from interviews and other qualitative data collection methods into categories. Using this method, designers gather input from many different people. Interviews focus on how people use tools as part of their job. By gathering all information together and categorizing, designers understand how tools might be used. Data are grouped together, and the patterns suggest the elements needed in the solution.
Thus far, designers have consolidated the feedback of EFC staff who use tools regularly. Now, designers are soliciting input from utilities to understand how we can make tools most effective and easy to use. EFC staff have sent surveys to the NCwater and NC City and County manager listservs. We have been thrilled with the response and are scheduling follow up interviews.

Consolidation of Interview Notes for Tools Analysis
Julia Cavalier joined the Environmental Finance Center in 2018. Julia has 15 years of experience in the water sector and 13 of those years spent with the North Carolina Public Water Supply Section. Julia has a B.S. in biology from Duke University, a M.S. in environmental engineering from North Carolina State University, and a Master’s of Science in Information Science at the University of North Carolina at Chapel Hill.
Robin Haley is currently a graduate student at the UNC School of Information and Library Science with coursework emphasis on database systems and digital services in archives. She completed her bachelor’s degree in Business Administration with a concentration in Information Systems from the University of North Carolina Wilmington in May 2020. She is now working on drinking water and wastewater rates dashboards at the UNC Environmental Finance Center.


