How financially healthy are the municipal residential electric utilities in North Carolina? That is a broad question, and one of keen interest to many customers of those utilities. This is especially true at a time when Duke Energy Progress and the North Carolina Eastern Municipal Power Agency (NCEMPA) are discussing the possibility of Duke Energy Progress purchasing NCEMPA’s electric generating assets, and where rate payers may be wondering what such a sale could mean for their future electric rates, as discussed in this previous blog post on affordability of residential electricity in N.C.
Cost Recovery and NC Residential Electric Rates Survey and Dashboard
One of the many ways into the investigation of the financial health of an electric utility is to look at its cost recovery. One way we do that at the Environmental Finance Center (EFC) is with our newly updated N.C. Residential Electric Rates Dashboard, where we calculate an operating ratio, which is then used for the Cost Recovery Dial (see Figure 1). This operating ratio is a measure of whether the utility’s revenue from its rates is sufficient to cover the cost of operations and capital (in the form of depreciation). It measures operating revenues divided by operating expenses (including depreciation), according to financial data from the North Carolina Local Government Commission (LGC) and the United States Energy Information Administration (EIA). A ratio of less than 1.0 could be a sign of financial concern. In general, this ratio should be higher than 1.0 to accommodate future capital investments; and a ratio of 1.2 or greater may be desirable.

The EFC has now completed a statewide survey of residential electric rate structures (103 out of 105 utilities responded for a 98% response rate) as part of a project funded by the Z. Smith Reynolds Foundation. During the survey, we were able to collect cost recovery data on 63 of the 69 municipal residential electric utilities responding to the survey. Looking just at the EIA data, we found that 20 out of the 63 utilities had negative operating margins, or roughly one third of them. Combining the EIA and LGC data, and calculating the operating ratio for each utility, we found that approximately 70% of the utilities had an operating ratio greater than or equal to 1; and 5% had a 1.2 or greater operating ratio.
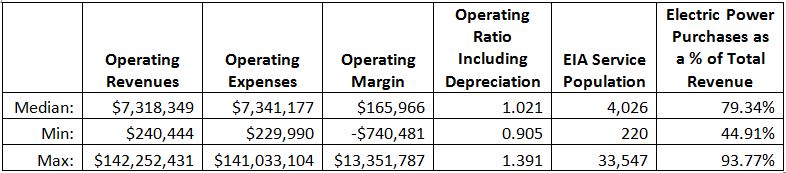
Table 1. Descriptive Statistics for N.C. Municipal Electric Utilities. (Source: NC LGC; US EIA)
(Please note that each column should be considered independently of the others.)
Factors Potentially Influencing Municipal Electric Utility Cost Recovery
The natural next questions are, for the one third of utilities that have low operating ratios or operating margins, who are they, and what may be contributing to the financial difficulties of their electric utility enterprise funds? An analysis was conducted on whether utility size (as measured by EIA service population) was predictive of the operating ratio. No clear correlation was found between service population and operating ratio; some smaller utilities have a high operating ratio, some a low one, and the same holds true with larger utilities as well.
Therefore, we must look elsewhere for a common cause. Drawing on the EFC’s work several years ago, my colleagues Casey Wichman and Jeff Hughes stated in their report, “Residential Electricity Rates and Pricing in North Carolina 2011,” that “when analyzing residential electricity rates, it is important to consider the supply-side factors that influence a utility’s rate-setting practices. The price of electricity, paid by the customer, should reflect the utility’s cost of providing that electricity.” Hence let us look at a graph of operating margins for the 63 municipal residential electric utilities, plotted against their monthly-equivalent bills at 1,000 kWh/month:

As you can see, there is no apparent relationship between the two factors in this graph; operating margins are both high and low for customers with both high and low residential electric bills. However, we do see once again that there are numerous municipal utilities that have costs exceeding revenues, which is not generally considered a best practice in enterprise fund theory.
Continuing our investigation, looking back the rightmost column of Table 1, our survey also collected data on how much electric power purchases were for FY2013 for utilities as a percentage of their total operating revenue. The range is wide, with a median percentage of approximately 79%, a low of 45%, and a high of 94%. Could this be predictive of operating margins of those utilities? And perhaps related to the magnitude of customers’ bills as well?
 at 1,000 kWh/month and Median annual operating margins, grouped by Power purchases as a percentage of total annual operating revenues.")
If you remove the highs (only one utility in the 90-95% range) and lows (only one utility in the 40-55% range) from this graph, the overall trend among those 61 utilities becomes more pronounced. The general trend is that (1) the higher the power purchases as a percentage of total annual operating revenues, the higher the median electric bills; and (2) the higher the power purchases percentage, the lower the median operating margin of the utilities. (Thirty nine of the 61 utilities fall into the 75% – 90% range of the power purchases data.)
Segmentation Analysis for Municipal Electric Utility Cost Recovery
Nevertheless, while this appears helpful, the variation in the data among the 61 utilities does invite further analysis, such as a segmentation analysis by the three groups of municipal utilities in the survey: (1) North Carolina Eastern Municipal Power Agency (NCEMPA) members, located in the eastern half of the state; (2) North Carolina Municipal Power Agency Number 1 (NCMPA1) members, located in the western half of the state; and (3) other municipal electric power utilities, located throughout the state, who are not members of NCEMPA or NCMPA1. (Note: Both NCEMPA and NCMPA1 are part of ElectriCities of North Carolina, Inc., which provides support for the work of both power agencies.)
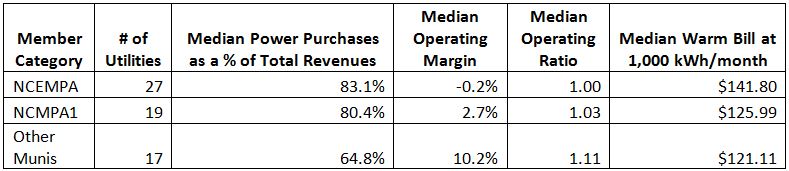
Table 2. Median Statistics for NCEMPA, NCMPA1, and other Municipal Residential Electric Utilities.
Here the trend seems more clear, where the NCEMPA members, based upon median statistics, are the worst off in terms of higher power purchases as a percentage of total revenues, lower operating margins (expressed here as a percentage of total revenues), and lower operating ratios (including depreciation). The “Other” group members are the best off from the median statistics, in terms of lower power purchase percentages, and higher operating margins and operating ratios. Also, median electric bills (at 1,000 kWh/month) are highest for NCEMPA customers and lowest for the customers of the “Other” group of electric utilities.
This latter point fits with other studies of the affordability and cost recovery of electricity for NCEMPA customers, such as in a recent, unpublished report on electricity prices in eastern North Carolina, prepared by Mark Little for the Kenan Institute for Private Enterprise. Among Mr. Little’s findings, he determined that:
- NCEMPA residential electricity customers pay 14 cents/kWh vs. the average NC price of about 10 cents/kWh, and NCEMPA commercial customers pay 11.7 cents/kWh vs. the 8 cents/kWh state average.
- The electricity cost differential is in the tens of millions annually for each NCEMPA utility relative to average NC prices for residential, commercial, and industrial users, and that NCEMPA’s cumulative electricity cost differential was almost $240 million in 2009.
- This was true despite the fact that NCEMPA residential customers use less electricity than the state average, and that lower income residential customers tend to pay the highest electricity prices in North Carolina.
Of course, NCEMPA’s high long-term capital indebtedness is well documented, such as in this summary from ElectriCities.
In this network of issues surrounding residential electric utility cost recovery, affordability, and average electricity consumption, questions for further research remain. To take just a few:
- Given that NCEMPA customers consume less electricity per capita (just over 12 MWh / customer / year) compared to the N.C. state average (around 13.5 MWh / customer / year), according to the Kenan Institute’s research, why is it that NCEMPA’s financials indicate a significantly higher power purchase percentage than is typical for N.C. municipal electric utilities overall?
- To what extent may this be related to the condition of these utilities’ transmission and distribution assets? Or to what extent may this be related to the demand peak management strategies employed by the various municipal electric utilities?
- Also, what new, actionable solutions could be employed, prior to the eventual liquidation of NCEMPA’s long-term capital debt, to ease the burden of NCEMPA customers and the corresponding economic impact of high electricity prices on the eastern part of North Carolina?
These are, of course, complex and long-term questions to investigate, and we at the EFC hope that our ongoing research on residential electricity rates and pricing in North Carolina will help to shed further light on potential solutions for municipal electric utilities and customers in eastern N.C. and throughout the state.
One Response to “Watts Up With Cost Recovery for Municipal Residential Electric Utilities in North Carolina?”
What's the Buzz about NC Electricity Rates?Environmental Finance Blog
[…] Watts Up with Cost Recovery for Municipal Residential Electric Utilities in NC? […]