Dashboards
Utility Rates Dashboards
Financial Sustainability Tools and Rates Dashboards are interactive tools designed to assist water, wastewater, and stormwater utility managers and local officials benchmark rates/fees and financial performance of the utility based on comparisons to utilities of similar characteristics.
These dashboards are designed and produced by the Environmental Finance Center at UNC. Rates and financial performance data are collected from hundreds of utilities in many states, combined with system characteristics, customer base socioeconomic conditions, geographical information, and other data. All of the data are loaded into the dashboards which visualize each utility’s information in simple graphics to convey a comprehensive benchmarking assessment of the utility’s rates and financial performance. Metrics are sometimes benchmarked against specific targets or by comparison to other utilities of similar characteristics.
The EFC conducts surveys and achieves higher than 85% participation from all utilities in the states, or partners with other organizations that conduct surveys. Data displayed on the dashboard are available for download from links provided on the dashboard webpages.
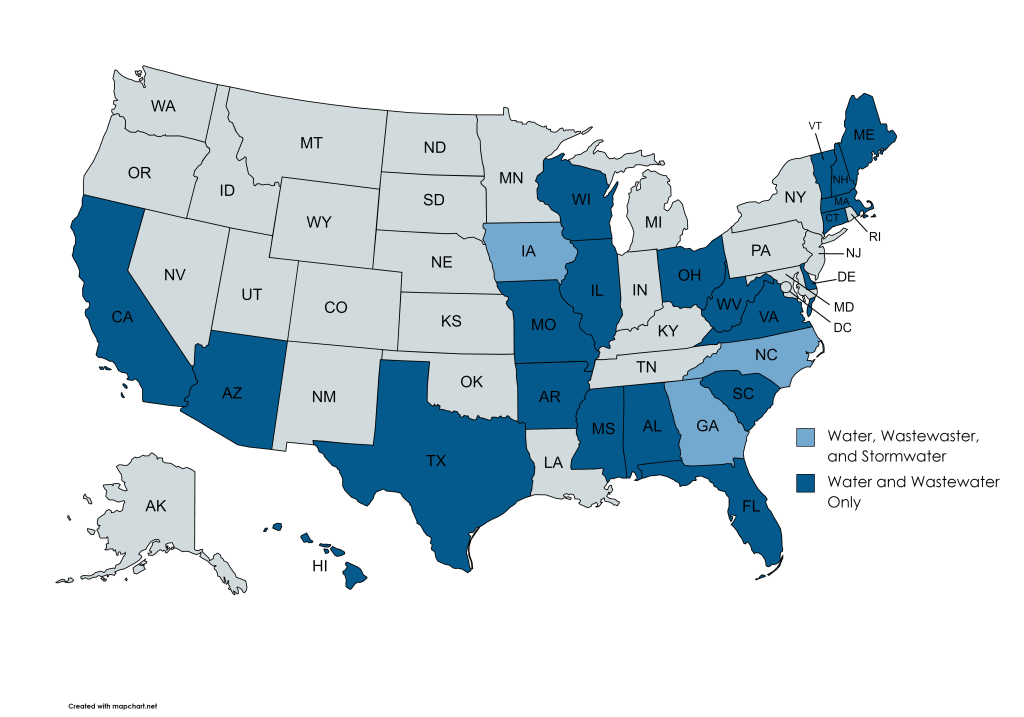
Water and wastewater rates and finance dashboards are available for the states below. Stormwater fees dashboards are listed where available.


